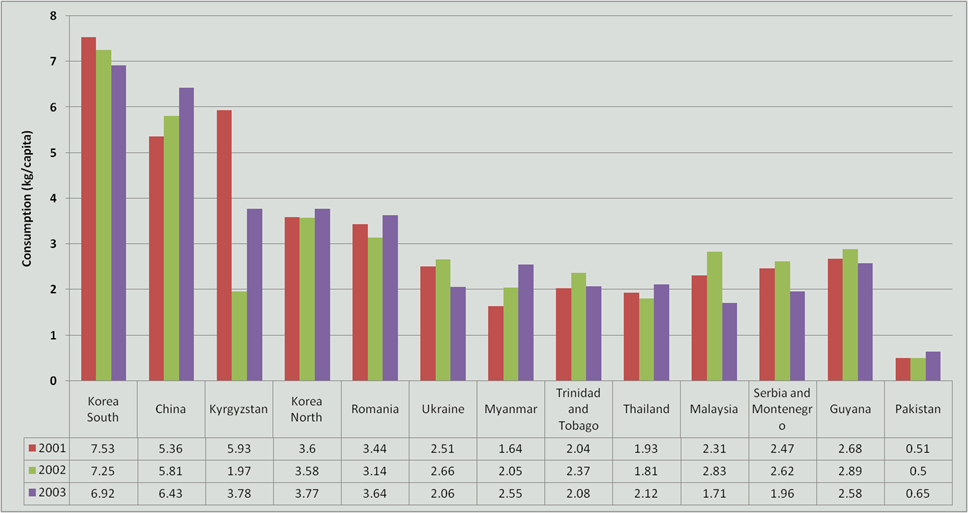
| World Consumption of GARLIC | |||||||
| Consumption in kg/capita | |||||||
| S.No. | Countries | 2001 | 2002 | 2003 | |||
| 1 | Korea South | 7.53 | 7.25 | 6.92 | |||
| 2 | China | 5.36 | 5.81 | 6.43 | |||
| 3 | Kyrgyzstan | 5.93 | 1.97 | 3.78 | |||
| 4 | Korea North | 3.6 | 3.58 | 3.77 | |||
| 5 | Romania | 3.44 | 3.14 | 3.64 | |||
| 6 | Ukraine | 2.51 | 2.66 | 2.06 | |||
| 7 | Myanmar | 1.64 | 2.05 | 2.55 | |||
| 8 | Trinidad and Tobago | 2.04 | 2.37 | 2.08 | |||
| 9 | Thailand | 1.93 | 1.81 | 2.12 | |||
| 10 | Malaysia | 2.31 | 2.83 | 1.71 | |||
| 11 | Serbia and Montenegro | 2.47 | 2.62 | 1.96 | |||
| 12 | Guyana | 2.68 | 2.89 | 2.58 | |||
| 13 | Pakistan | 0.51 | 0.5 | 0.65 | |||
| Avg of top 12 Countries | 41.46 | 38.99 | 39.61 | ||||
| Total of other 140 Countries | 93.82 | 91.28 | 96.12 | ||||
| World Total | 135.79 | 130.77 | 136.37 | ||||
| Source:FAO | |||||||
|
|
|||||||