Sheet 1: Wheat
|
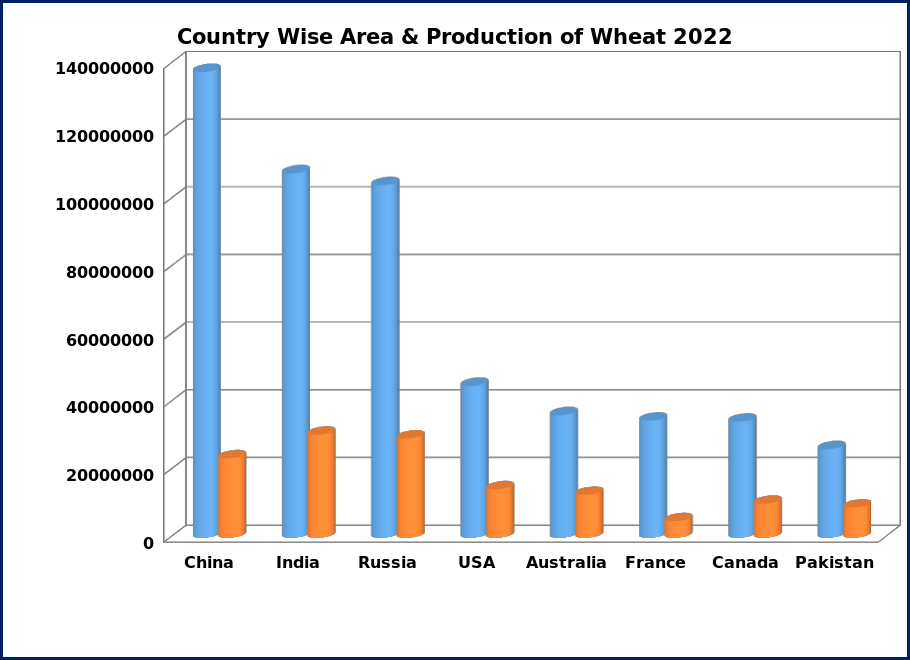
Country Wise Area
& Production of Wheat 2022 |
|
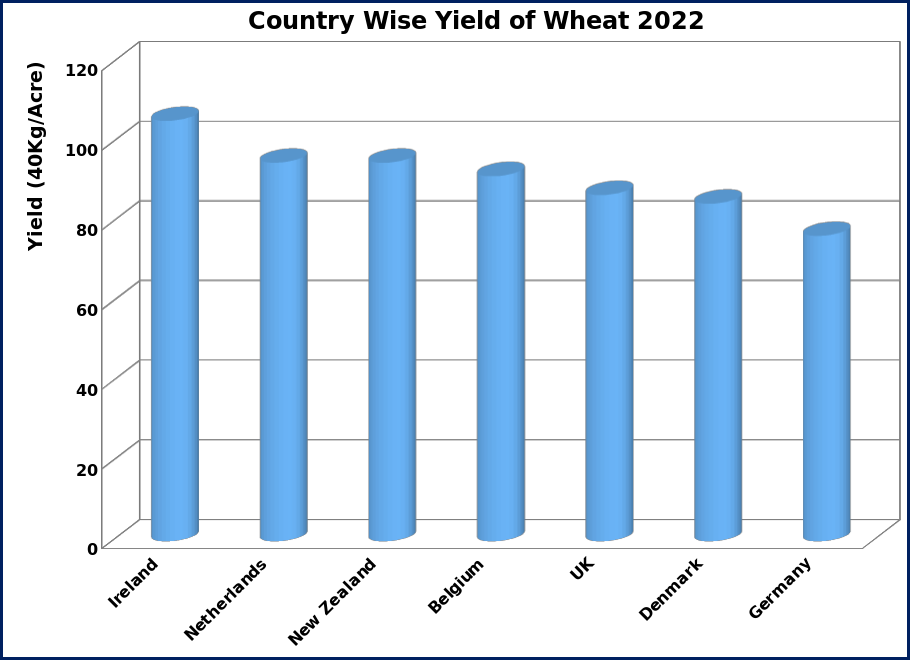
Country Wise Yield of
Wheat 2022 |
||||||
|
Sr. No. |
Countries |
Production (Tons) |
Area
(Hectares) |
%age Share |
|
Sr. No. |
Countries |
40Kg/Acre |
|
1 |
China |
137720000 |
23520000 |
17.04 |
|
1 |
Ireland |
106 |
|
2 |
India |
107742070 |
30458530 |
13.33 |
|
2 |
Netherlands |
95 |
|
3 |
Russia |
104233944 |
29354766 |
12.89 |
|
3 |
New Zealand |
95 |
|
4 |
USA |
44902320 |
14358400 |
5.55 |
|
4 |
Belgium |
92 |
|
5 |
Australia |
36237477 |
12728252 |
4.48 |
|
5 |
UK |
87 |
|
6 |
France |
34632380 |
4949840 |
4.28 |
|
6 |
Denmark |
85 |
|
7 |
Canada |
34334787 |
10081900 |
4.25 |
|
7 |
Germany |
77 |
|
8 |
Pakistan |
26208672 |
8976900 |
3.24 |
|
8 |
Zambia |
71 |
|
9 |
Germany |
22587300 |
2980900 |
2.79 |
|
9 |
France |
71 |
|
10 |
Argentina |
22150287 |
6548477 |
2.74 |
|
10 |
Sweden |
71 |
|
11 |
Ukraine |
20729240 |
5281500 |
2.56 |
|
11 |
Saudi Arabia |
69 |
|
12 |
Türkiye |
19750000 |
6601805 |
2.44 |
|
12 |
Egypt |
69 |
|
13 |
Kazakhstan |
16404491 |
12889831 |
2.03 |
|
13 |
Luxembourg |
64 |
|
14 |
UK |
15540000 |
1809000 |
1.92 |
|
14 |
Mexico |
62 |
|
15 |
Poland |
13195120 |
2518440 |
1.63 |
|
15 |
Czechia |
61 |
|
Total Top 15 Countries |
656368088 |
149538541 |
81.19 |
|
Source: FAO |
|
|
|
|
Total Other 108 Countries |
152073480 |
69615291 |
18.81 |
|
|
|
|
|
|
World Total |
808441568 |
219153832 |
100.00 |
|
|
|
|
|
|
Source: FAO |
|
|
|
|
|
|
|
|
<hr size=2 width="100%" align=center>
Sheet 2: Wheat Graph
|
|
|
![]()
Sheet 3: Wheat Yield
|
|
|
![]()
Sheet 4: Maize
|
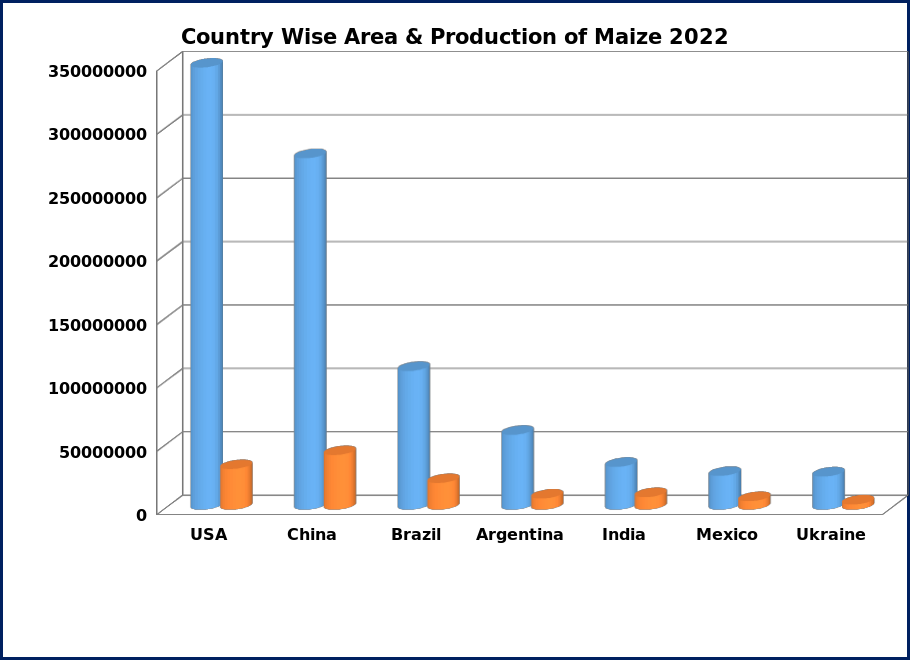
Country Wise Area
& Production of Maize 2022 |
|
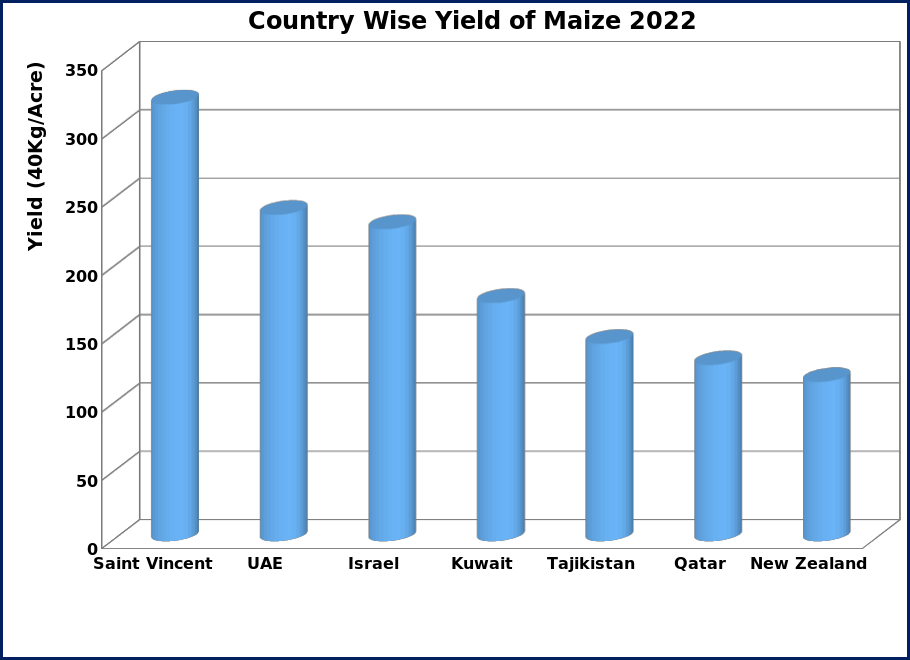
Country Wise Yield of
Maize 2022 |
||||||
|
Sr. No. |
Countries |
Production (Tons) |
Area
(Hectares) |
%age Share |
|
Sr. No. |
Countries |
40Kg/Acre |
|
1 |
USA |
348750930 |
32054280 |
29.97 |
|
1 |
Saint Vincent |
320 |
|
2 |
China |
277203000 |
43070000 |
23.82 |
|
2 |
UAE |
239 |
|
3 |
Brazil |
109420717 |
21037669 |
9.40 |
|
3 |
Israel |
229 |
|
4 |
Argentina |
59037179 |
8768441 |
5.07 |
|
4 |
Kuwait |
174 |
|
5 |
India |
33729540 |
9957950 |
2.90 |
|
5 |
Tajikistan |
145 |
|
6 |
Mexico |
26625694 |
6777997 |
2.29 |
|
6 |
Qatar |
129 |
|
7 |
Ukraine |
26186930 |
4124500 |
2.25 |
|
7 |
New Zealand |
117 |
|
8 |
Indonesia |
23564000 |
4067231 |
2.03 |
|
8 |
Spain |
116 |
|
9 |
South Africa |
16137000 |
3001800 |
1.39 |
|
9 |
Chile |
112 |
|
10 |
Russia |
15862434 |
2644243 |
1.36 |
|
10 |
USA |
110 |
|
11 |
Canada |
14538878 |
1443900 |
1.25 |
|
11 |
Greece |
107 |
|
12 |
Nigeria |
12948920 |
5800000 |
1.11 |
|
12 |
Uzbekistan |
106 |
|
13 |
France |
10877190 |
1456090 |
0.93 |
|
13 |
Canada |
102 |
|
14 |
Ethiopia |
10200000 |
2550000 |
0.88 |
|
14 |
Switzerland |
100 |
|
15 |
Pakistan |
10183109 |
1719598 |
0.88 |
|
15 |
Austria |
99 |
|
Total Top 15 Countries |
995265521 |
148473699 |
85.54 |
|
Source: FAO |
|
|
|
|
Total Other 149 Countries |
168231862 |
54996312 |
14.46 |
|
|
|
|
|
|
World Total |
1163497383 |
203470011 |
100.00 |
|
|
|
|
|
|
Source: FAO |
|
|
|
|
|
|
|
|
<hr size=2 width="100%" align=center>
Sheet 5: Maize Graph
|
|
|

Sheet 6: Maize Yield
|
|
|
![]()
Sheet 7: Rice (Paddy)
|
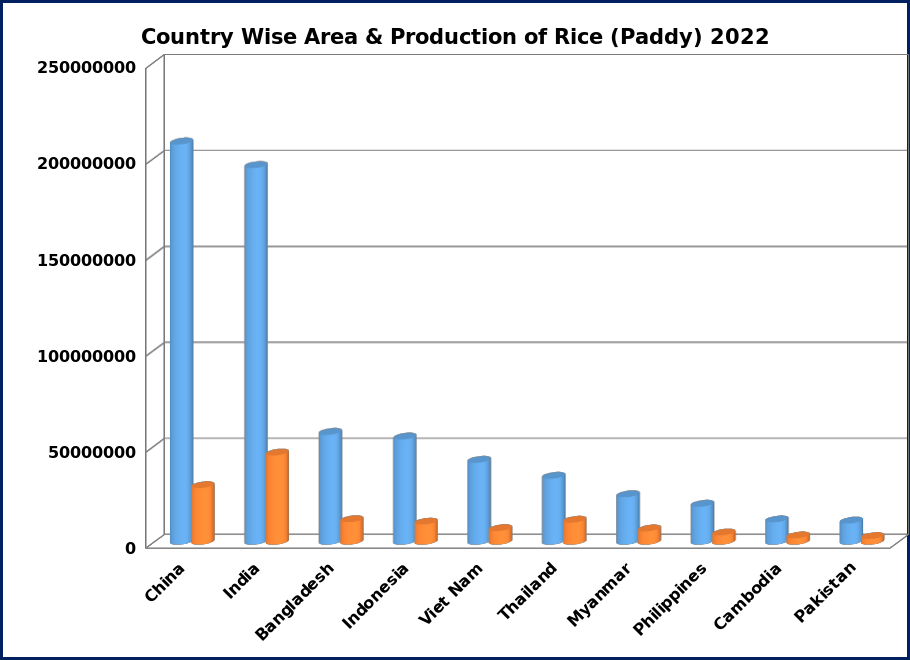
Country Wise Area
& Production of Rice (Paddy) 2022 |
|
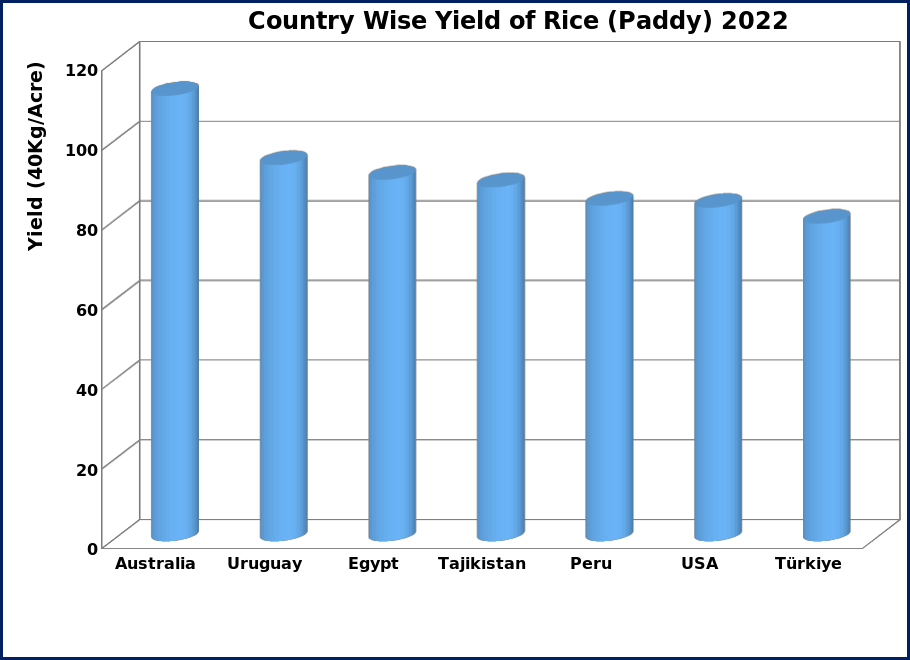
Country Wise Yield of
Rice (Paddy) 2022 |
||||||
|
Sr. No. |
Countries |
Production (Tons) |
Area
(Hectares) |
%age Share |
|
Sr. No. |
Countries |
40Kg/Acre |
|
1 |
China |
208494800 |
29450000 |
26.85 |
|
1 |
Australia |
112 |
|
2 |
India |
196245700 |
46400000 |
25.27 |
|
2 |
Uruguay |
94 |
|
3 |
Bangladesh |
57189193 |
11692365 |
7.37 |
|
3 |
Egypt |
91 |
|
4 |
Indonesia |
54748977 |
10452672 |
7.05 |
|
4 |
Tajikistan |
89 |
|
5 |
Viet Nam |
42672339 |
7089024 |
5.50 |
|
5 |
Peru |
84 |
|
6 |
Thailand |
34317028 |
11484233 |
4.42 |
|
6 |
USA |
84 |
|
7 |
Myanmar |
24680200 |
6899300 |
3.18 |
|
7 |
Türkiye |
80 |
|
8 |
Philippines |
19756392 |
4804498 |
2.54 |
|
8 |
Morocco |
79 |
|
9 |
Cambodia |
11624000 |
3303000 |
1.50 |
|
9 |
Uzbekistan |
78 |
|
10 |
Pakistan |
10983081 |
2976239 |
1.41 |
|
10 |
Greece |
75 |
|
11 |
Brazil |
10776268 |
1623420 |
1.39 |
|
11 |
China |
72 |
|
12 |
Japan |
10363900 |
1497500 |
1.33 |
|
12 |
Japan |
70 |
|
13 |
Nigeria |
8502000 |
4580000 |
1.09 |
|
13 |
Korea |
70 |
|
14 |
USA |
7274170 |
878990 |
0.94 |
|
14 |
El Salvador |
69 |
|
15 |
Egypt |
5800000 |
646316 |
0.75 |
|
15 |
Brazil |
67 |
|
Total Top 15 Countries |
703428048 |
143777557 |
90.59 |
|
Source: FAO |
|
|
|
|
Total Other 101 Countries |
73033409 |
21261272 |
9.41 |
|
|
|
|
|
|
World Total |
776461457 |
165038829 |
100.00 |
|
|
|
|
|
|
Source: FAO |
|
|
|
|
|
|
|
|
<hr size=2 width="100%" align=center>
Sheet 8: Rice Graph
|
|
|
![]()
Sheet 9: Rice Yield
|
|
|
![]()
Sheet 10: Sugarcane
|
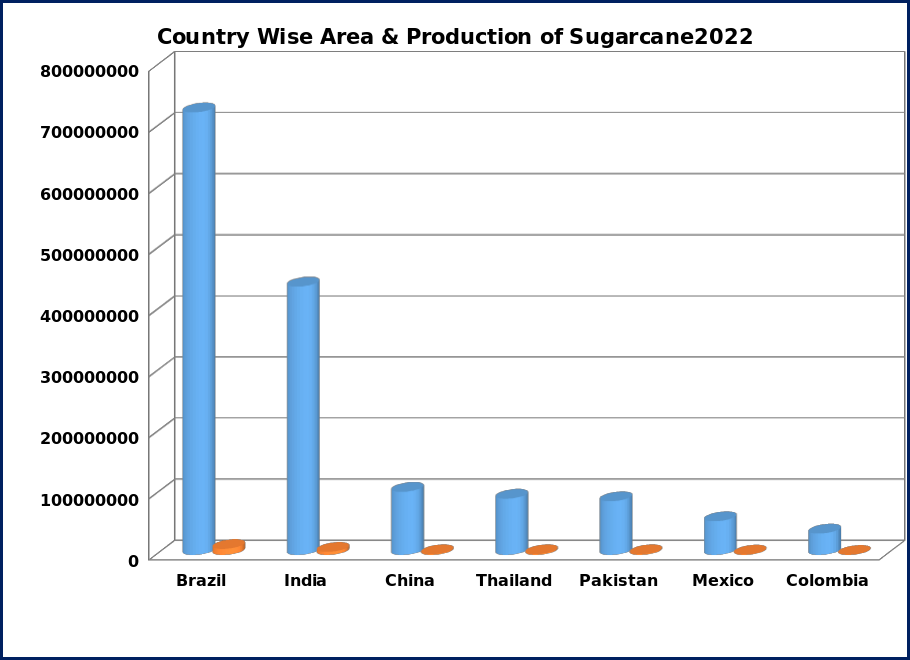
Country Wise Area
& Production of Sugarcane 2022 |
|
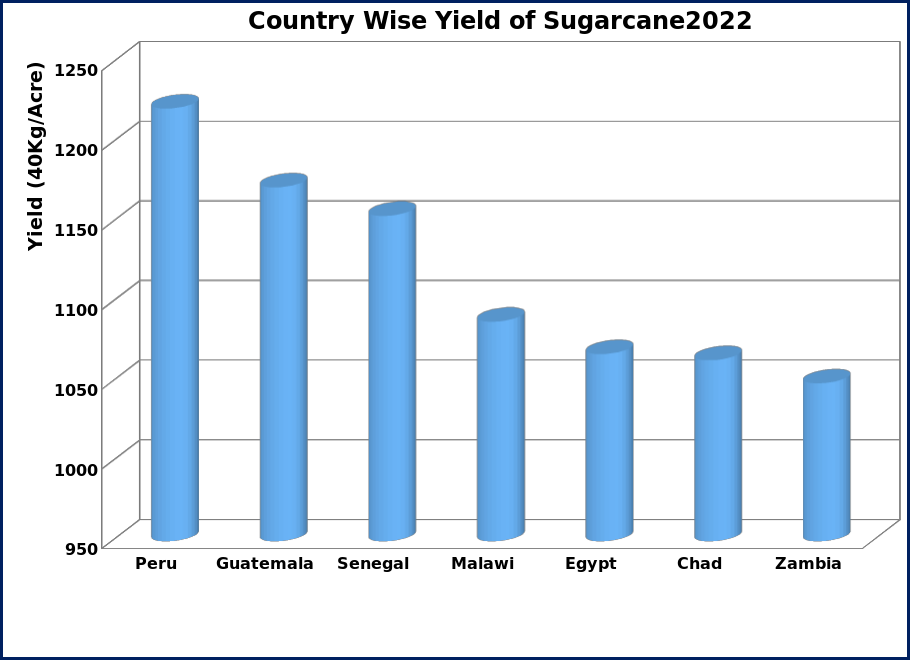
Country Wise Yield of
Sugarcane 2022 |
||||||
|
Sr. No. |
Countries |
Production (Tons) |
Area
(Hectares) |
%age Share |
|
Sr. No. |
Countries |
40Kg/Acre |
|
1 |
Brazil |
724428135 |
9870590 |
37.69 |
|
1 |
Peru |
1222 |
|
2 |
India |
439424890 |
5175410 |
22.86 |
|
2 |
Guatemala |
1172 |
|
3 |
China |
103381300 |
1293600 |
5.38 |
|
3 |
Senegal |
1154 |
|
4 |
Thailand |
92095784 |
1525070 |
4.79 |
|
4 |
Malawi |
1088 |
|
5 |
Pakistan |
87981135 |
1318837 |
4.58 |
|
5 |
Egypt |
1067 |
|
6 |
Mexico |
55279459 |
808790 |
2.88 |
|
6 |
Chad |
1064 |
|
7 |
Colombia |
35040528 |
368830 |
1.82 |
|
7 |
Zambia |
1049 |
|
8 |
Indonesia |
32400000 |
494230 |
1.69 |
|
8 |
Burkina Faso |
1032 |
|
9 |
USA |
31456630 |
375800 |
1.64 |
|
9 |
Nicaragua |
1010 |
|
10 |
Australia |
28669280 |
336003 |
1.49 |
|
10 |
Iran |
987 |
|
11 |
Guatemala |
26079734 |
225116 |
1.36 |
|
11 |
Eswatini |
981 |
|
12 |
Philippines |
23455404 |
401390 |
1.22 |
|
12 |
El Salvador |
970 |
|
13 |
South Africa |
17991000 |
258403 |
0.94 |
|
13 |
Colombia |
961 |
|
14 |
Argentina |
16583045 |
345679 |
0.86 |
|
14 |
French Polynesia |
919 |
|
15 |
Egypt |
15976836 |
151425 |
0.83 |
|
15 |
Australia |
863 |
|
Total Top 15 Countries |
1730243159 |
22949173 |
90.02 |
|
Source: FAO |
|
|
|
|
Total Other 78 Countries |
191816692 |
3140816 |
9.98 |
|
|
|
|
|
|
World Total |
1922059851 |
26089989 |
100.00 |
|
|
|
|
|
|
Source: FAO |
|
|
|
|
|
|
|
|
<hr size=2 width="100%" align=center>
Sheet 11: Sugarcane Graph
|
|
|
![]()
Sheet 12: Sugarcane Yield
|
|
|
![]()
Sheet 13: Chick Peas
|
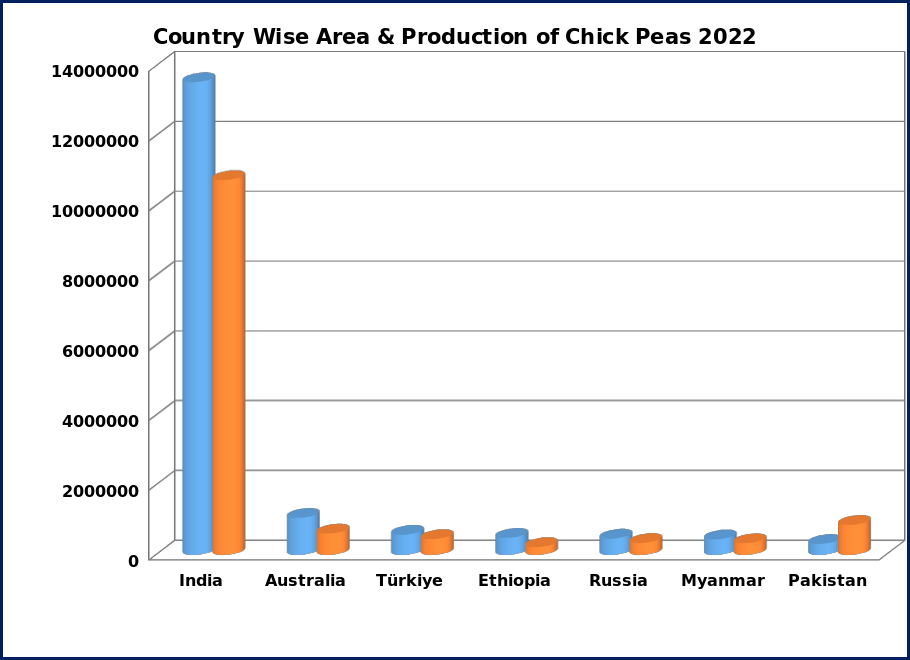
Country Wise Area
& Production of Gram (Chick Peas) 2022 |
|
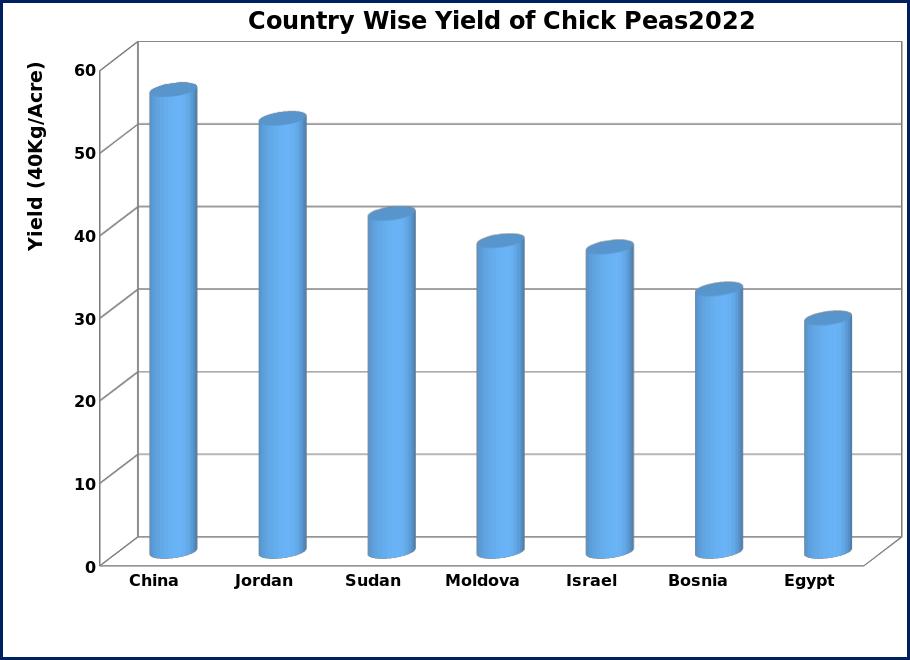
Country Wise Yield of
Chick Peas 2022 |
||||||
|
Sr. No. |
Countries |
Production (Tons) |
Area
(Hectares) |
%age Share |
|
Sr. No. |
Countries |
40Kg/Acre |
|
1 |
India |
13543630 |
10740100 |
74.85 |
|
1 |
China |
56 |
|
2 |
Australia |
1062250 |
615750 |
5.87 |
|
2 |
Jordan |
52 |
|
3 |
Türkiye |
580000 |
456480 |
3.21 |
|
3 |
Sudan |
41 |
|
4 |
Ethiopia |
492691 |
227040 |
2.72 |
|
4 |
Moldova |
38 |
|
5 |
Russia |
467934 |
344499 |
2.59 |
|
5 |
Israel |
37 |
|
6 |
Myanmar |
447500 |
340212 |
2.47 |
|
6 |
Bosnia |
32 |
|
7 |
Pakistan |
316176 |
861688 |
1.75 |
|
7 |
Egypt |
28 |
|
8 |
Mexico |
189037 |
111672 |
1.04 |
|
8 |
Uzbekistan |
28 |
|
9 |
Iran |
176080 |
429670 |
0.97 |
|
9 |
Yemen |
22 |
|
10 |
USA |
165920 |
138360 |
0.92 |
|
10 |
Ethiopia |
22 |
|
11 |
Canada |
127929 |
94700 |
0.71 |
|
11 |
Zimbabwe |
21 |
|
12 |
Argentina |
102099 |
81435 |
0.56 |
|
12 |
Iraq |
20 |
|
13 |
Sudan |
96505 |
23843 |
0.53 |
|
13 |
Bolivia |
20 |
|
14 |
Tanzania |
92246 |
95213 |
0.51 |
|
14 |
Australia |
17 |
|
15 |
Algeria |
37991 |
33835 |
0.21 |
|
15 |
Mexico |
17 |
|
Total Top 15 Countries |
17897987 |
14594497 |
98.91 |
|
Source: FAO |
|
|
|
|
Total Other 34 Countries |
197261 |
216416 |
1.09 |
|
|
|
|
|
|
World Total |
18095248 |
14810913 |
100.00 |
|
|
|
|
|
|
Source: FAO |
|
|
|
|
|
|
|
|
<hr size=2 width="100%" align=center>
Sheet 14: Chick Peas Graph
|
|
|
![]()
Sheet 15: Chick Peas Yield
|
|
|
![]()
Sheet 16: Lentil
|
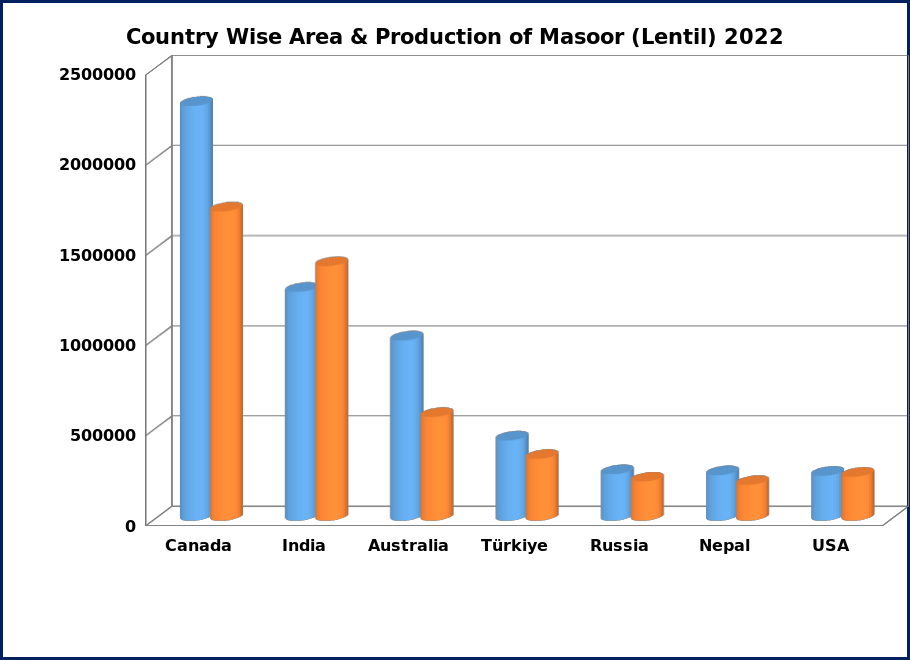
Country Wise Area
& Production of Lentil 2022 |
|
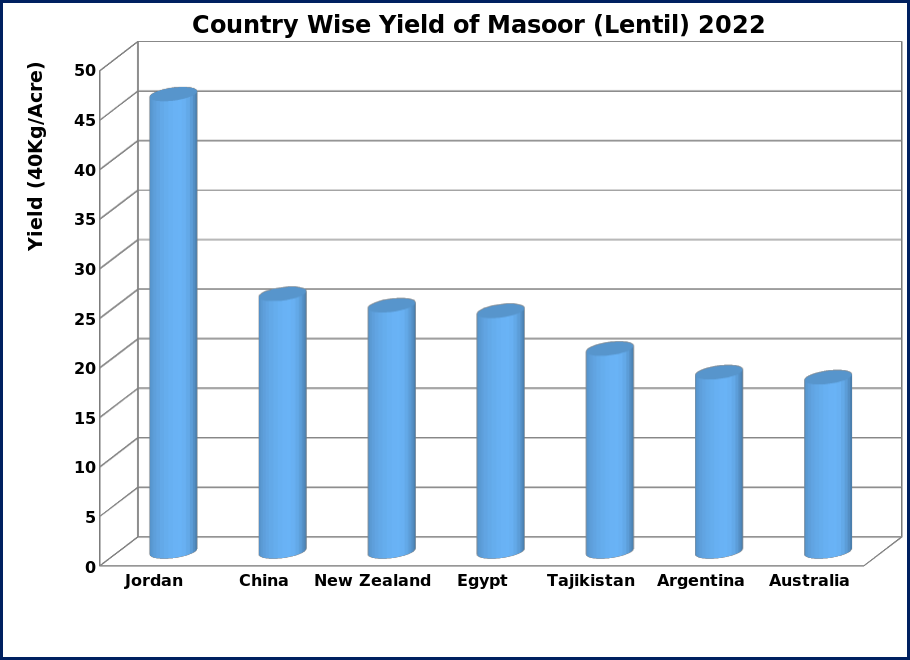
Country Wise Yield of
Lentil 2022 |
||||||
|
Sr. No. |
Countries |
Production (Tons) |
Area
(Hectares) |
%age Share |
|
Sr. No. |
Countries |
40Kg/Acre |
|
1 |
Canada |
2300598 |
1715100 |
34.57 |
|
1 |
Jordan |
46 |
|
2 |
India |
1268830 |
1411920 |
19.06 |
|
2 |
China |
26 |
|
3 |
Australia |
999500 |
575200 |
15.02 |
|
3 |
New Zealand |
25 |
|
4 |
Türkiye |
445000 |
342577 |
6.69 |
|
4 |
Egypt |
24 |
|
5 |
Russia |
257896 |
216865 |
3.87 |
|
5 |
Tajikistan |
20 |
|
6 |
Nepal |
252283 |
198454 |
3.79 |
|
6 |
Argentina |
18 |
|
7 |
USA |
248980 |
243620 |
3.74 |
|
7 |
Australia |
18 |
|
8 |
Bangladesh |
190743 |
144454 |
2.87 |
|
8 |
Palestine |
16 |
|
9 |
China |
167441 |
65160 |
2.52 |
|
9 |
Iraq |
15 |
|
10 |
Kazakhstan |
145942 |
143287 |
2.19 |
|
10 |
Ethiopia |
15 |
|
11 |
Ethiopia |
134783 |
92580 |
2.03 |
|
11 |
Armenia |
15 |
|
12 |
Iran |
76738 |
132342 |
1.15 |
|
12 |
North Macedonia |
14 |
|
13 |
Argentina |
72318 |
40456 |
1.09 |
|
13 |
Mexico |
14 |
|
14 |
Syria |
26614 |
81363 |
0.40 |
|
14 |
Canada |
14 |
|
15 |
Mexico |
12448 |
9104 |
0.19 |
|
15 |
Lebanon |
13 |
|
Total Top 15 Countries |
6600115 |
5412482 |
99.16 |
|
Source: FAO |
|
|
|
|
19 |
Pakistan |
3868 |
6437 |
0.06 |
|
|
|
|
|
Total Other 27 Countries |
51845 |
84686 |
0.78 |
|
|
|
|
|
|
World Total |
6655828 |
5503605 |
100.00 |
|
|
|
|
|
|
Source: FAO |
|
|
|
|
|
|
|
|
<hr size=2 width="100%" align=center>
Sheet 17: Lentil Graph
|
|
|

Sheet 18: Lentil Yield
|
|
|
![]()
Sheet 19: Potato
|
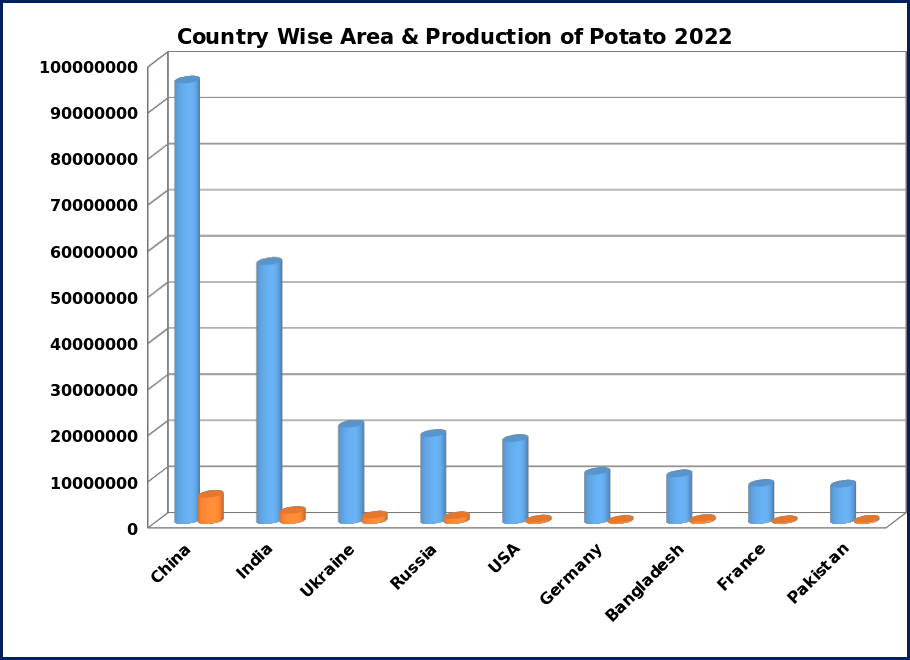
Country Wise Area
& Production of Potato 2022 |
|
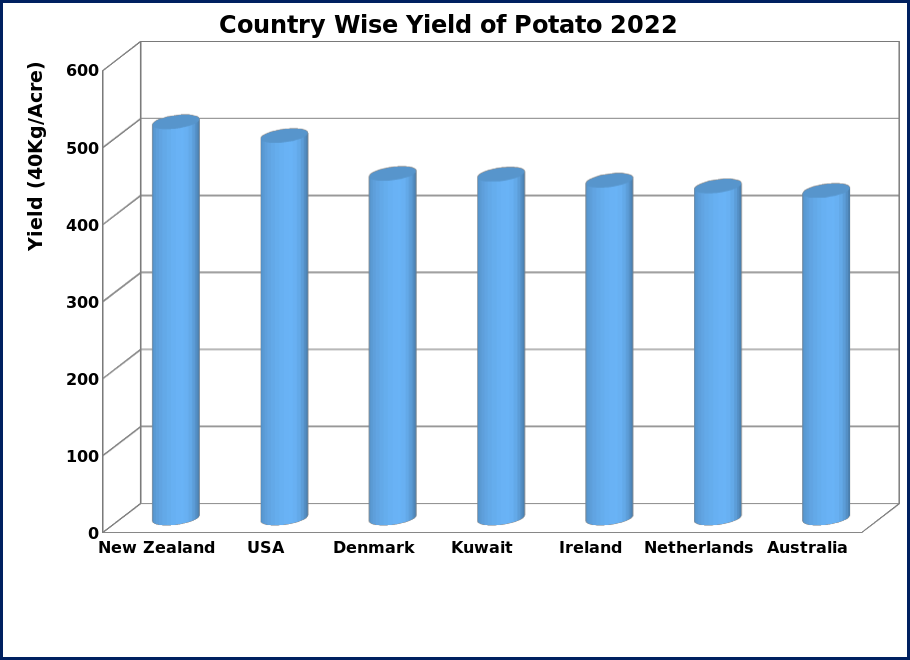
Country Wise Yield of
Potato 2022 |
||||||
|
Sr. No. |
Countries |
Production (Tons) |
Area
(Hectares) |
%age Share |
|
Sr. No. |
Countries |
40Kg/Acre |
|
1 |
China |
95570055 |
5723449 |
25.50 |
|
1 |
New Zealand |
515 |
|
2 |
India |
56176000 |
2226000 |
14.99 |
|
2 |
USA |
497 |
|
3 |
Ukraine |
20899210 |
1204300 |
5.58 |
|
3 |
Denmark |
447 |
|
4 |
Russia |
18887679 |
1086482 |
5.04 |
|
4 |
Kuwait |
446 |
|
5 |
USA |
17791840 |
362440 |
4.75 |
|
5 |
Ireland |
438 |
|
6 |
Germany |
10683400 |
266400 |
2.85 |
|
6 |
Netherlands |
431 |
|
7 |
Bangladesh |
10144835 |
464011 |
2.71 |
|
7 |
Australia |
425 |
|
8 |
France |
8067380 |
211670 |
2.15 |
|
8 |
Canada |
424 |
|
9 |
Pakistan |
7936884 |
314125 |
2.12 |
|
9 |
Germany |
406 |
|
10 |
Netherlands |
6915900 |
162300 |
1.85 |
|
10 |
Jordan |
404 |
|
11 |
Canada |
6248376 |
149042 |
1.67 |
|
11 |
Belgium |
394 |
|
12 |
Egypt |
6155467 |
213272 |
1.64 |
|
12 |
France |
386 |
|
13 |
Poland |
6030930 |
196110 |
1.61 |
|
13 |
UK |
383 |
|
14 |
Peru |
6021030 |
341468 |
1.61 |
|
14 |
South Africa |
382 |
|
15 |
Türkiye |
5200000 |
139072 |
1.39 |
|
15 |
Türkiye |
378 |
|
Total Top 15 Countries |
282728986 |
13060141 |
75.44 |
|
Source: FAO |
|
|
|
|
Total Other 139 Countries |
92048777 |
4728271 |
24.56 |
|
|
|
|
|
|
World Total |
374777763 |
17788412 |
100.00 |
|
|
|
|
|
|
Source: FAO |
|
|
|
|
|
|
|
|
<hr size=2 width="100%" align=center>
Sheet 20: Potato Graph
|
|
|
![]()
Sheet 21: Potato Yield
|
|
|
![]()
Sheet 22: Onion
|
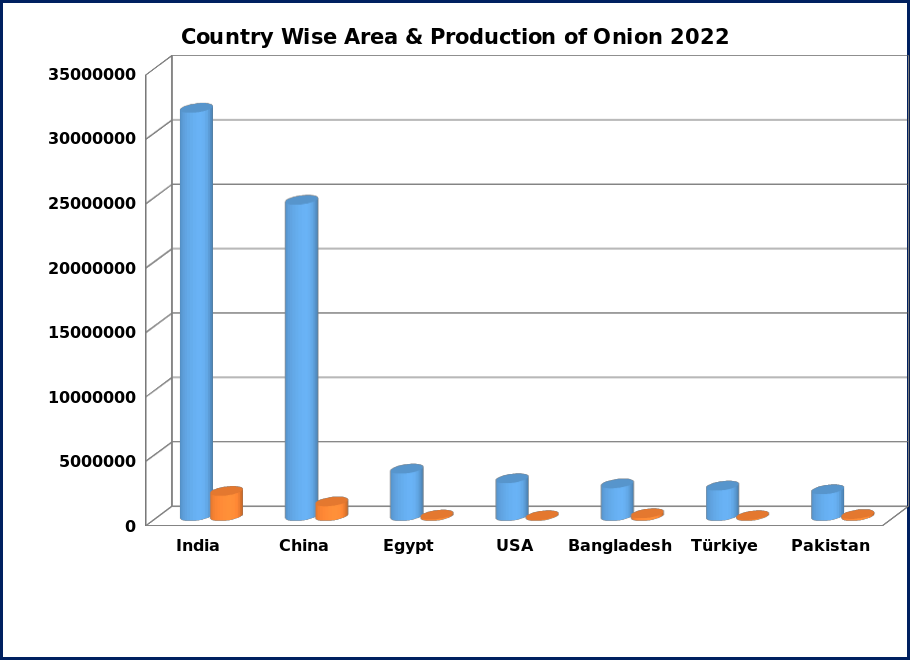
Country Wise Area
& Production of Onion 2022 |
|
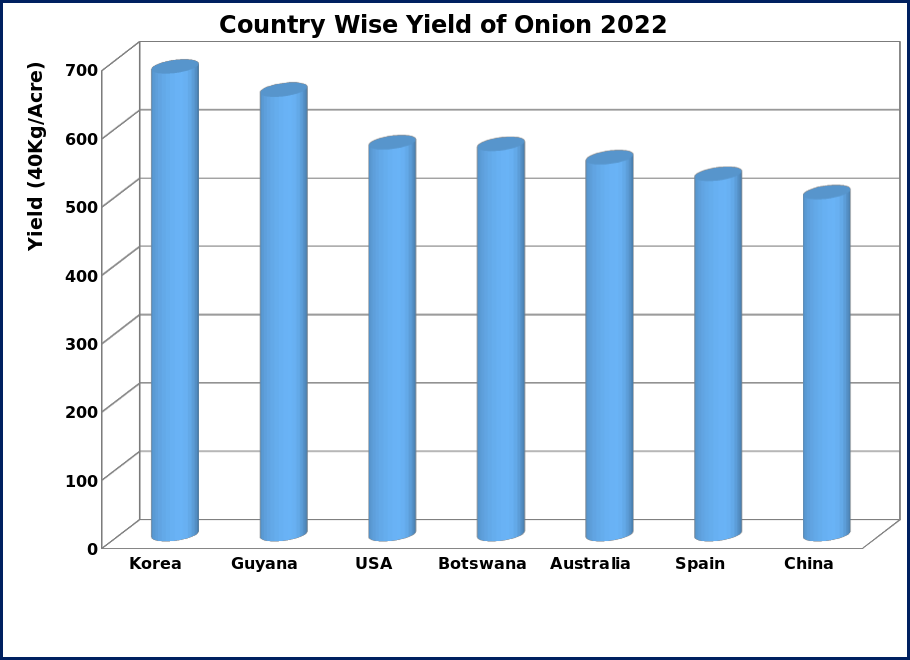
Country Wise Yield of
Onion 2022 |
||||||
|
Sr. No. |
Countries |
Production (Tons) |
Area
(Hectares) |
%age Share |
|
Sr. No. |
Countries |
40Kg/Acre |
|
1 |
India |
31687000 |
1941000 |
28.65 |
|
1 |
Korea |
685 |
|
2 |
China |
24542011 |
1121596 |
22.19 |
|
2 |
Guyana |
651 |
|
3 |
Egypt |
3663943 |
105880 |
3.31 |
|
3 |
USA |
574 |
|
4 |
USA |
2918958 |
51477 |
2.64 |
|
4 |
Botswana |
571 |
|
5 |
Bangladesh |
2517070 |
205405 |
2.28 |
|
5 |
Australia |
552 |
|
6 |
Türkiye |
2350000 |
57630 |
2.12 |
|
6 |
Spain |
527 |
|
7 |
Pakistan |
2062336 |
140838 |
1.86 |
|
7 |
China |
501 |
|
8 |
Indonesia |
1982360 |
184984 |
1.79 |
|
8 |
Canada |
500 |
|
9 |
Iran |
1900000 |
50000 |
1.72 |
|
9 |
Austria |
494 |
|
10 |
Algeria |
1763118 |
50078 |
1.59 |
|
10 |
Japan |
487 |
|
11 |
Brazil |
1656076 |
48895 |
1.50 |
|
11 |
Chile |
487 |
|
12 |
Russia |
1599256 |
51008 |
1.45 |
|
12 |
Netherlands |
452 |
|
13 |
Sudan |
1591709 |
88307 |
1.44 |
|
13 |
Sweden |
443 |
|
14 |
Nigeria |
1554966 |
596146 |
1.41 |
|
14 |
Türkiye |
413 |
|
15 |
Mexico |
1509161 |
49067 |
1.36 |
|
15 |
Lebanon |
410 |
|
Total Top 15 Countries |
83297965 |
4742311 |
75.30 |
|
Source: FAO |
|
|
|
|
Total Other 125 Countries |
27318305 |
1225178 |
24.70 |
|
|
|
|
|
|
World Total |
110616270 |
5967489 |
100.00 |
|
|
|
|
|
|
Source: FAO |
|
|
|
|
|
|
|
|
<hr size=2 width="100%" align=center>
Sheet 23: Onion Graph
|
|
|
![]()
Sheet 24: Onion Yield
|
|
|
![]()
Sheet 25: Tomato
|
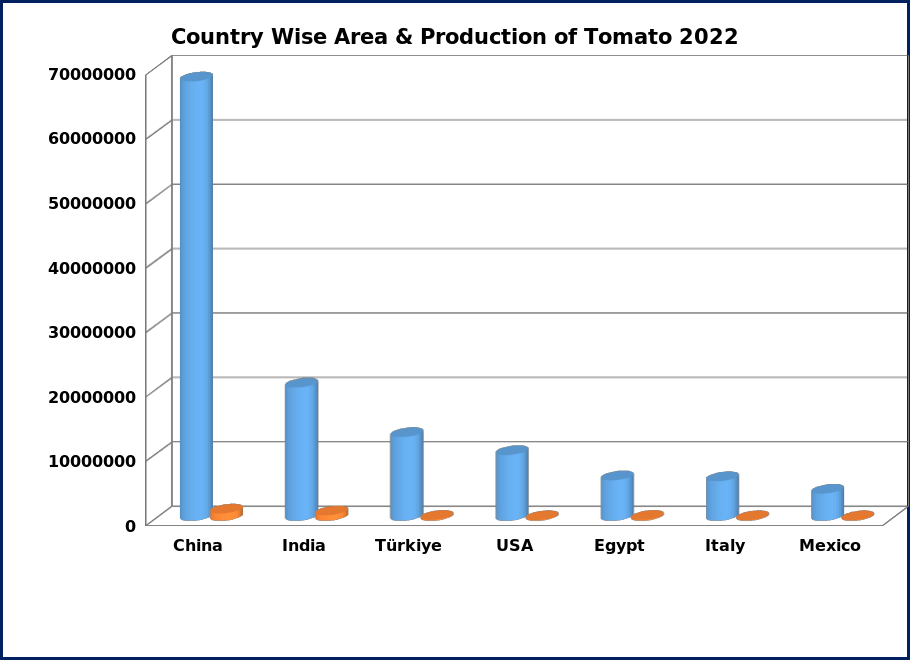
Country Wise Area
& Production of Tomato 2022 |
|
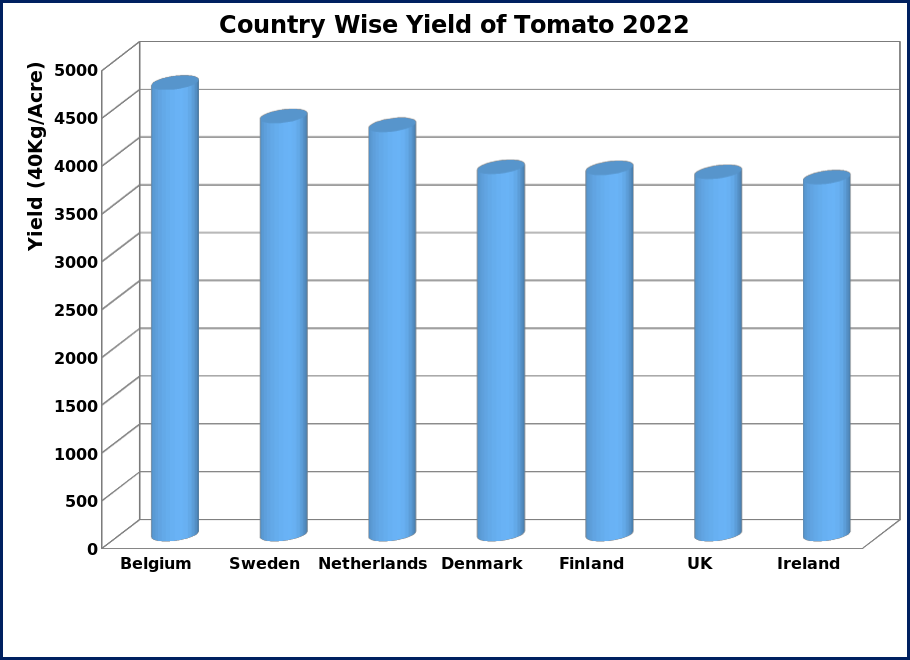
Country Wise Yield of
Tomato 2022 |
||||||
|
Sr. No. |
Countries |
Production (Tons) |
Area
(Hectares) |
%age Share |
|
Sr. No. |
Countries |
40Kg/Acre |
|
1 |
China |
68241811 |
1137416 |
36.67 |
|
1 |
Belgium |
4723 |
|
2 |
India |
20694000 |
843000 |
11.12 |
|
2 |
Sweden |
4373 |
|
3 |
Türkiye |
13000000 |
158719 |
6.99 |
|
3 |
Netherlands |
4280 |
|
4 |
USA |
10199753 |
106757 |
5.48 |
|
4 |
Denmark |
3841 |
|
5 |
Egypt |
6275444 |
143618 |
3.37 |
|
5 |
Finland |
3830 |
|
6 |
Italy |
6136380 |
97610 |
3.30 |
|
6 |
UK |
3789 |
|
7 |
Mexico |
4207889 |
90696 |
2.26 |
|
7 |
Ireland |
3733 |
|
8 |
Brazil |
3809986 |
54502 |
2.05 |
|
8 |
Iceland |
3695 |
|
9 |
Nigeria |
3684566 |
702275 |
1.98 |
|
9 |
Norway |
3611 |
|
10 |
Spain |
3651940 |
45150 |
1.96 |
|
10 |
Austria |
2882 |
|
11 |
Iran |
3400000 |
77000 |
1.83 |
|
11 |
Germany |
2720 |
|
12 |
Russia |
2645662 |
78300 |
1.42 |
|
12 |
Switzerland |
2007 |
|
13 |
Uzbekistan |
2191153 |
64226 |
1.18 |
|
13 |
Palestine |
1492 |
|
14 |
Algeria |
1661664 |
25050 |
0.89 |
|
14 |
Kuwait |
1373 |
|
15 |
Mozambique |
1599051 |
60570 |
0.86 |
|
15 |
France |
1221 |
|
Total Top 15 Countries |
151399299 |
3684889 |
81.35 |
|
Source: FAO |
|
|
|
|
26 |
Pakistan |
792938 |
66697 |
0.43 |
|
|
|
|
|
Total Other 151 Countries |
33915735 |
1165948 |
18.22 |
|
|
|
|
|
|
World Total |
186107973 |
4917534 |
100.00 |
|
|
|
|
|
|
Source: FAO |
|
|
|
|
|
|
|
|
<hr size=2 width="100%" align=center>
Sheet 26: Tomato Graph
|
|
|

Sheet 27: Tomato Yield
|
|
|
![]()
Sheet 28: Chilli
|
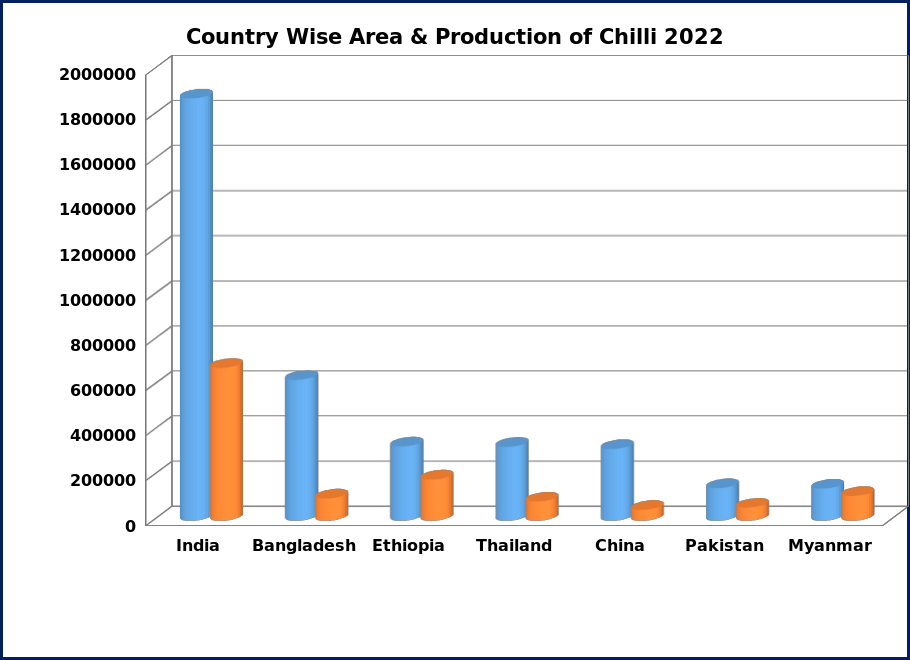
Country Wise Area
& Production of Chilli 2022 |
|
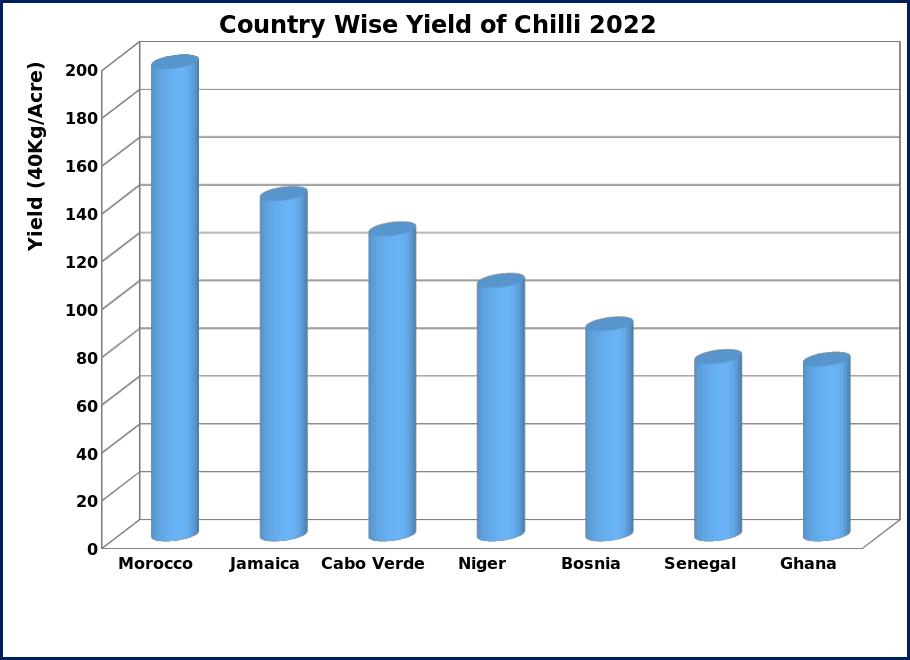
Country Wise Yield of
Chilli 2022 |
||||||
|
Sr. No. |
Countries |
Production (Tons) |
Area
(Hectares) |
%age Share |
|
Sr. No. |
Countries |
40Kg/Acre |
|
1 |
India |
1874000 |
678000 |
38.17 |
|
1 |
Morocco |
198 |
|
2 |
Bangladesh |
624825 |
98324 |
12.73 |
|
2 |
Jamaica |
142 |
|
3 |
Ethiopia |
329378 |
182875 |
6.71 |
|
3 |
Cabo Verde |
128 |
|
4 |
Thailand |
327384 |
84880 |
6.67 |
|
4 |
Niger |
106 |
|
5 |
China |
318063 |
48113 |
6.48 |
|
5 |
Bosnia |
88 |
|
6 |
Pakistan |
144160 |
58169 |
2.94 |
|
6 |
Senegal |
74 |
|
7 |
Myanmar |
142459 |
109863 |
2.90 |
|
7 |
Ghana |
73 |
|
8 |
Benin |
133412 |
37467 |
2.72 |
|
8 |
China |
67 |
|
9 |
Côte d'Ivoire |
131083 |
25939 |
2.67 |
|
9 |
Nepal |
66 |
|
10 |
Ghana |
108170 |
14951 |
2.20 |
|
10 |
Bangladesh |
64 |
|
11 |
Viet Nam |
99697 |
68115 |
2.03 |
|
11 |
Peru |
62 |
|
12 |
Nepal |
83898 |
12870 |
1.71 |
|
12 |
Grenada |
61 |
|
13 |
Nigeria |
65405 |
37823 |
1.33 |
|
13 |
Côte d'Ivoire |
51 |
|
14 |
Egypt |
62178 |
17163 |
1.27 |
|
14 |
North Macedonia |
48 |
|
15 |
Mexico |
60987 |
30784 |
1.24 |
|
15 |
Uzbekistan |
46 |
|
Total Top 15 Countries |
4505099 |
1505336 |
91.77 |
|
Source: FAO |
|
|
|
|
Total Other 108 Countries |
404221 |
140115 |
8.23 |
|
|
|
|
|
|
World Total |
4909321 |
1645451 |
100.00 |
|
|
|
|
|
|
Source: FAO |
|
|
|
|
|
|
|
|
<hr size=2 width="100%" align=center>
Sheet 29: Chilli Graph
|
|
|
![]()
Sheet 30: Chilli Yield
|
|
|
![]()
Sheet 31: Garlic
|
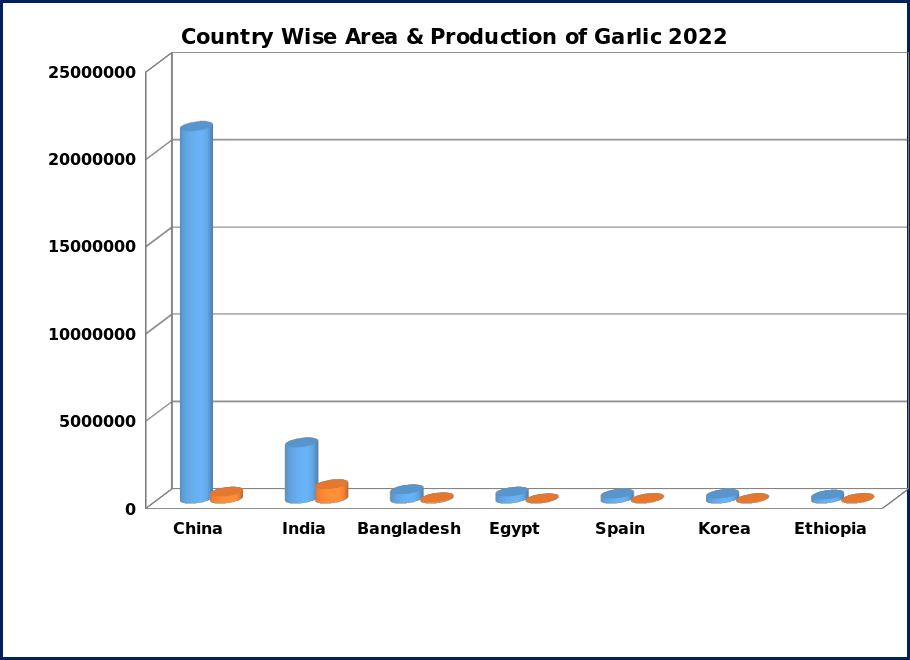
Country Wise Area
& Production of Garlic 2022 |
|
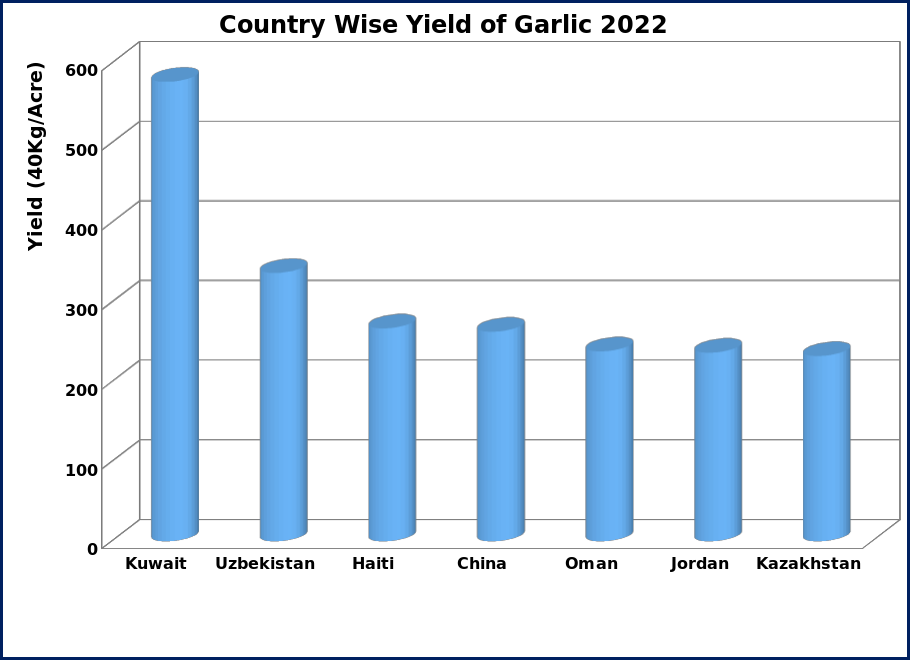
Country Wise Yield of
Garlic 2022 |
||||||
|
Sr. No. |
Countries |
Production (Tons) |
Area
(Hectares) |
%age Share |
|
Sr. No. |
Countries |
40Kg/Acre |
|
1 |
China |
21337798 |
393000 |
73.20 |
|
1 |
Kuwait |
577 |
|
2 |
India |
3208000 |
820470 |
11.01 |
|
2 |
Uzbekistan |
337 |
|
3 |
Bangladesh |
526819 |
72211 |
1.81 |
|
3 |
Haiti |
267 |
|
4 |
Egypt |
396478 |
17946 |
1.36 |
|
4 |
China |
263 |
|
5 |
Spain |
281900 |
29800 |
0.97 |
|
5 |
Oman |
238 |
|
6 |
Korea |
272759 |
22362 |
0.94 |
|
6 |
Jordan |
237 |
|
7 |
Ethiopia |
218807 |
29131 |
0.75 |
|
7 |
Kazakhstan |
233 |
|
8 |
Uzbekistan |
210348 |
6319 |
0.72 |
|
8 |
Egypt |
224 |
|
9 |
USA |
204797 |
10441 |
0.70 |
|
9 |
USA |
198 |
|
10 |
Myanmar |
203292 |
27407 |
0.70 |
|
10 |
Türkiye |
195 |
|
11 |
Algeria |
202060 |
11249 |
0.69 |
|
11 |
Algeria |
182 |
|
12 |
Ukraine |
188980 |
20500 |
0.65 |
|
12 |
Albania |
164 |
|
13 |
Brazil |
181149 |
13305 |
0.62 |
|
13 |
Kyrgyzstan |
162 |
|
14 |
Argentina |
154685 |
16003 |
0.53 |
|
14 |
Colombia |
153 |
|
15 |
Russia |
147744 |
17365 |
0.51 |
|
15 |
Tajikistan |
150 |
|
Total Top 15 Countries |
27735615 |
1507509 |
95.15 |
|
Source: FAO |
|
|
|
|
17 |
Pakistan |
107986 |
12586 |
0.37 |
|
|
|
|
|
Total Other 88 Countries |
1305837 |
142288 |
4.48 |
|
|
|
|
|
|
World Total |
29149438 |
1662383 |
100.00 |
|
|
|
|
|
|
Source: FAO |
|
|
|
|
|
|
|
|
<hr size=2 width="100%" align=center>
Sheet 32: Garlic Graph
|
|
|

Sheet 33: Garlic Yield
|
|
|
![]()
Sheet 34: Ginger
|
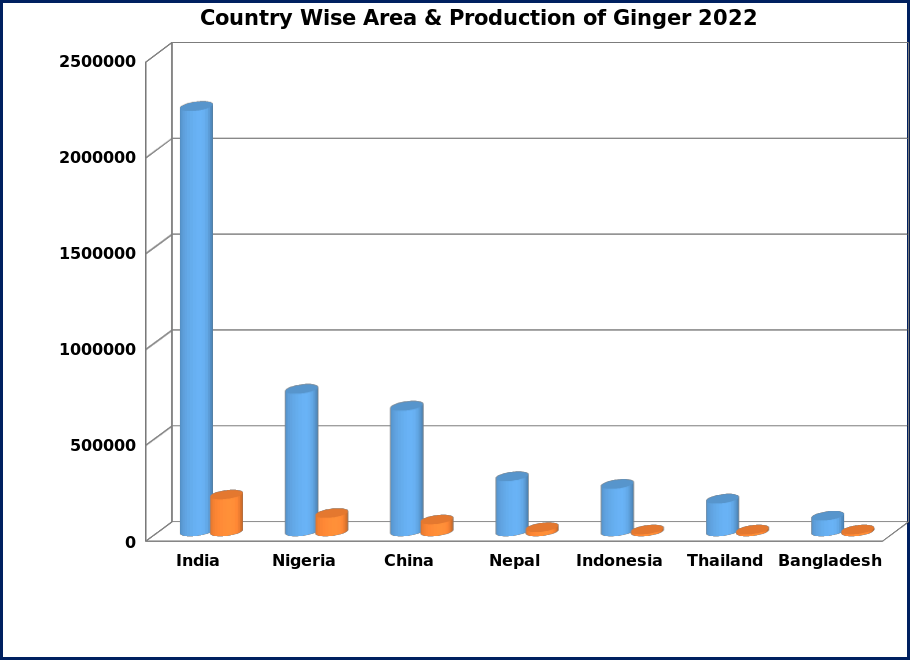
Country Wise Area
& Production of Ginger 2022 |
|
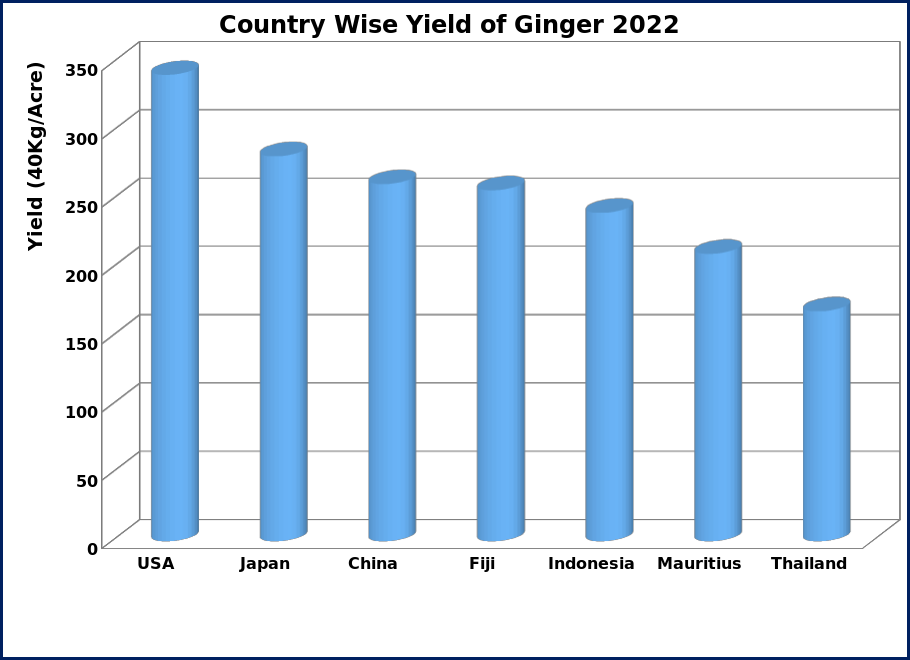
Country Wise Yield of
Ginger 2022 |
||||||
|
Sr. No. |
Countries |
Production (Tons) |
Area
(Hectares) |
%age Share |
|
Sr. No. |
Countries |
40Kg/Acre |
|
1 |
India |
2219000 |
193000 |
45.53 |
|
1 |
USA |
341 |
|
2 |
Nigeria |
743527 |
96120 |
15.25 |
|
2 |
Japan |
282 |
|
3 |
China |
655452 |
62458 |
13.45 |
|
3 |
China |
262 |
|
4 |
Nepal |
287813 |
22441 |
5.90 |
|
4 |
Fiji |
257 |
|
5 |
Indonesia |
247455 |
10409 |
5.08 |
|
5 |
Indonesia |
241 |
|
6 |
Thailand |
170887 |
10269 |
3.51 |
|
6 |
Mauritius |
210 |
|
7 |
Bangladesh |
82152 |
10429 |
1.69 |
|
7 |
Thailand |
168 |
|
8 |
Sri Lanka |
71931 |
6736 |
1.48 |
|
8 |
Côte d'Ivoire |
130 |
|
9 |
Peru |
59467 |
8001 |
1.22 |
|
9 |
Nepal |
130 |
|
10 |
Cameroon |
52393 |
5087 |
1.07 |
|
10 |
Mali |
128 |
|
11 |
Japan |
50996 |
1830 |
1.05 |
|
11 |
Guyana |
120 |
|
12 |
Guyana |
46054 |
3877 |
0.94 |
|
12 |
Costa Rica |
119 |
|
13 |
Mali |
39528 |
3121 |
0.81 |
|
13 |
Kenya |
118 |
|
14 |
Korea |
38321 |
3455 |
0.79 |
|
14 |
India |
116 |
|
15 |
Philippines |
28766 |
4057 |
0.59 |
|
15 |
Korea |
112 |
|
Total Top 15 Countries |
4793745 |
441290 |
98.35 |
|
Source: FAO |
|
|
|
|
40 |
Pakistan |
3 |
4 |
0.0001 |
|
|
|
|
|
Total Other 25 Countries |
80468 |
9352 |
1.65 |
|
|
|
|
|
|
World Total |
4874216 |
450646 |
100.00 |
|
|
|
|
|
|
Source: FAO |
|
|
|
|
|
|
|
|
<hr size=2 width="100%" align=center>
Sheet 35: Ginger Graph
|
|
|
![]()
Sheet 36: Ginger Yield
|
|
|
![]()
Sheet 37: Apple
|
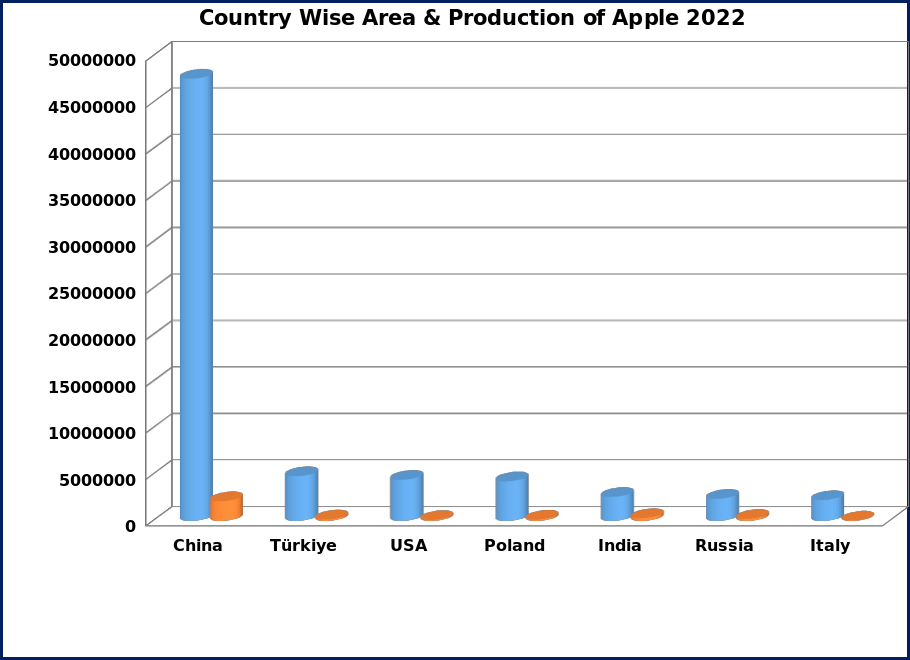
Country Wise Area
& Production of Apple 2022 |
|
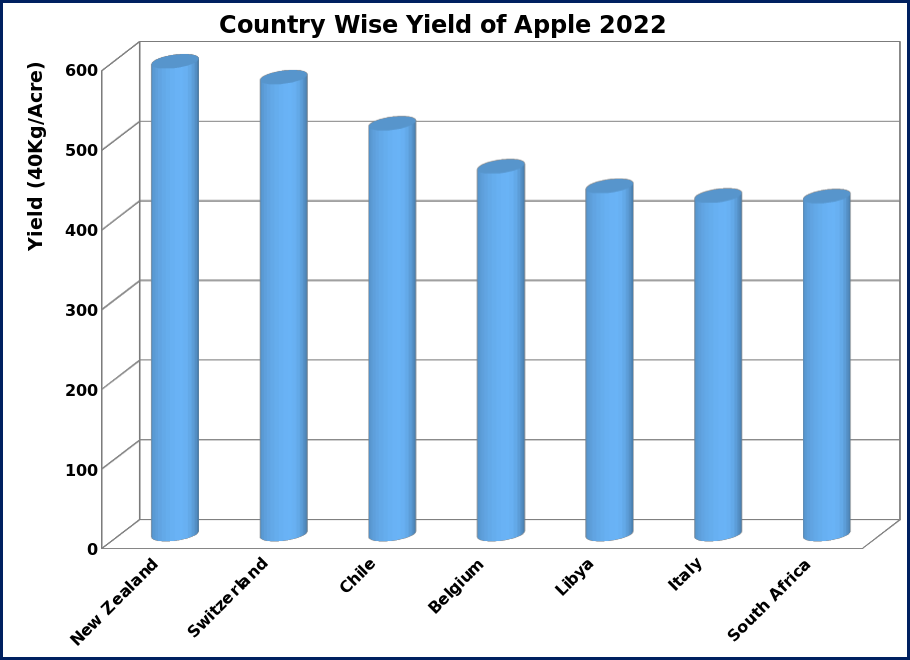
Country Wise Yield of
Apple 2022 |
||||||
|
Sr. No. |
Countries |
Production (Tons) |
Area
(Hectares) |
%age Share |
|
Sr. No. |
Countries |
40Kg/Acre |
|
1 |
China |
47571800 |
2128943 |
49.64 |
|
1 |
New Zealand |
594 |
|
2 |
Türkiye |
4817500 |
170941 |
5.03 |
|
2 |
Switzerland |
574 |
|
3 |
USA |
4429330 |
116753 |
4.62 |
|
3 |
Chile |
516 |
|
4 |
Poland |
4264700 |
151900 |
4.45 |
|
4 |
Belgium |
462 |
|
5 |
India |
2589000 |
315000 |
2.70 |
|
5 |
Libya |
437 |
|
6 |
Russia |
2379900 |
232842 |
2.48 |
|
6 |
Italy |
425 |
|
7 |
Italy |
2256240 |
53730 |
2.35 |
|
7 |
South Africa |
424 |
|
8 |
Iran |
1989734 |
87644 |
2.08 |
|
8 |
Austria |
419 |
|
9 |
France |
1785660 |
54020 |
1.86 |
|
9 |
UK |
410 |
|
10 |
Chile |
1479683 |
29035 |
1.54 |
|
10 |
Israel |
409 |
|
11 |
Uzbekistan |
1313233 |
122459 |
1.37 |
|
11 |
Netherlands |
405 |
|
12 |
South Africa |
1231867 |
29387 |
1.29 |
|
12 |
USA |
384 |
|
13 |
Ukraine |
1129120 |
76900 |
1.18 |
|
13 |
France |
334 |
|
14 |
Germany |
1070980 |
33110 |
1.12 |
|
14 |
Ireland |
331 |
|
15 |
Brazil |
1047217 |
33311 |
1.09 |
|
15 |
Germany |
327 |
|
Total Top 15 Countries |
79355964 |
3635975 |
82.80 |
|
Source: FAO |
|
|
|
|
20 |
Pakistan |
758298 |
74061 |
0.79 |
|
|
|
|
|
Total Other 79 Countries |
15721702 |
1115692 |
16.40 |
|
|
|
|
|
|
World Total |
95835965 |
4825728 |
100.00 |
|
|
|
|
|
|
Source: FAO |
|
|
|
|
|
|
|
|
<hr size=2 width="100%" align=center>
Sheet 38: Apple Graph
|
|
|

Sheet 39: Apple Yield
|
|
|
![]()
Sheet 40: Banana
|
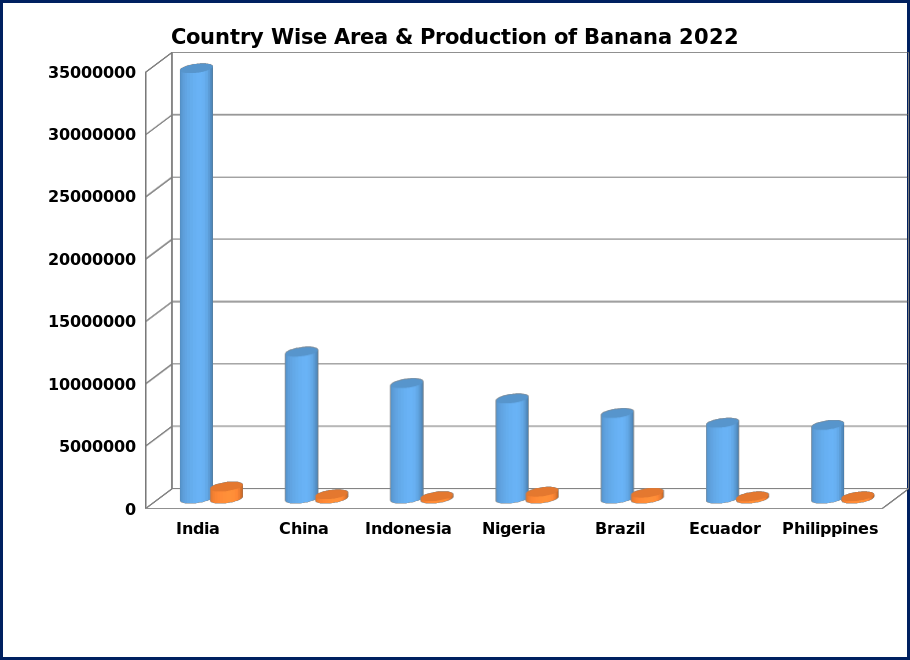
Country Wise Area
& Production of Banana 2022 |
|
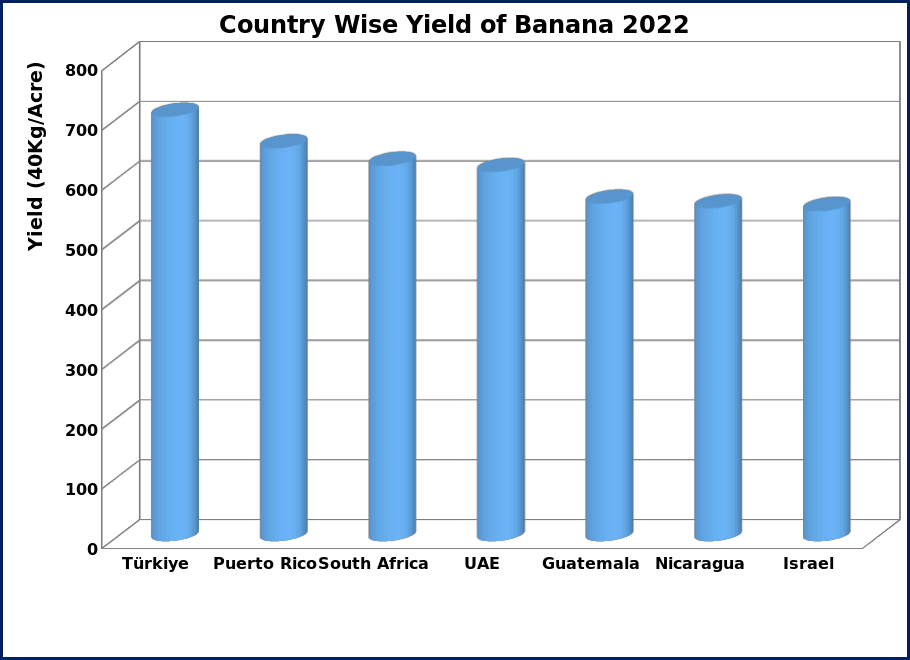
Country Wise Yield of
Banana 2022 |
||||||
|
Sr. No. |
Countries |
Production (Tons) |
Area
(Hectares) |
%age Share |
|
Sr. No. |
Countries |
40Kg/Acre |
|
1 |
India |
34528000 |
963000 |
25.56 |
|
1 |
Türkiye |
710 |
|
2 |
China |
11776800 |
341283 |
8.72 |
|
2 |
Puerto Rico |
658 |
|
3 |
Indonesia |
9245427 |
188488 |
6.84 |
|
3 |
South Africa |
628 |
|
4 |
Nigeria |
8019203 |
540387 |
5.94 |
|
4 |
UAE |
618 |
|
5 |
Brazil |
6854222 |
457910 |
5.07 |
|
5 |
Guatemala |
565 |
|
6 |
Ecuador |
6078789 |
167544 |
4.50 |
|
6 |
Nicaragua |
557 |
|
7 |
Philippines |
5899705 |
184859 |
4.37 |
|
7 |
Israel |
552 |
|
8 |
Guatemala |
4762667 |
85287 |
3.52 |
|
8 |
Costa Rica |
548 |
|
9 |
Angola |
4589099 |
172102 |
3.40 |
|
9 |
Bhutan |
533 |
|
10 |
Tanzania |
3500880 |
335714 |
2.59 |
|
10 |
Saudi Arabia |
527 |
|
11 |
Mexico |
2600601 |
84892 |
1.92 |
|
11 |
Jordan |
525 |
|
12 |
Colombia |
2521733 |
104823 |
1.87 |
|
12 |
Panama |
519 |
|
13 |
Viet Nam |
2514820 |
143804 |
1.86 |
|
13 |
Indonesia |
496 |
|
14 |
Costa Rica |
2494250 |
46058 |
1.85 |
|
14 |
Honduras |
480 |
|
15 |
Peru |
2392584 |
171073 |
1.77 |
|
15 |
Greece |
475 |
|
Total Top 15 Countries |
107778780 |
3987224 |
79.77 |
|
Source: FAO |
|
|
|
|
51 |
Pakistan |
215570 |
33197 |
0.16 |
|
|
|
|
|
Total Other 105 Countries |
27117976 |
1919736 |
20.07 |
|
|
|
|
|
|
World Total |
135112326 |
5940157 |
100.00 |
|
|
|
|
|
|
Source: FAO |
|
|
|
|
|
|
|
|
<hr size=2 width="100%" align=center>
Sheet 41: Banana Graph
|
|
|

Sheet 42: Banana Yield
|
|
|
![]()
Sheet 43: Dates
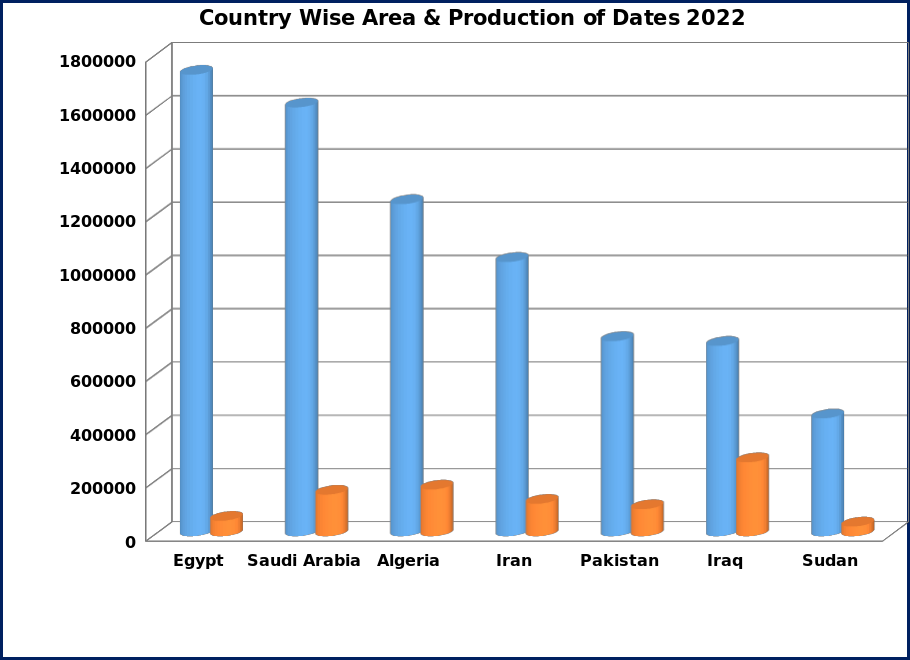
|
Country Wise Area
& Production of Dates 2022 |
|
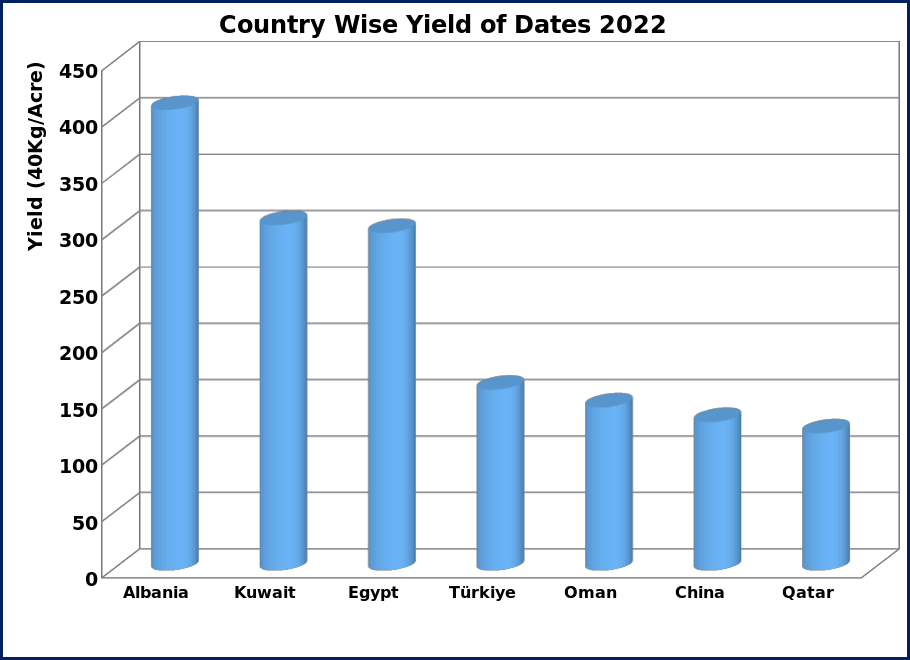
Country Wise Yield of
Dates 2022 |
||||||
|
Sr. No. |
Countries |
Production (Tons) |
Area
(Hectares) |
%age Share |
|
Sr. No. |
Countries |
40Kg/Acre |
|
1 |
Egypt |
1733432 |
58557 |
17.78 |
|
1 |
Albania |
409 |
|
2 |
Saudi Arabia |
1610731 |
156460 |
16.52 |
|
2 |
Kuwait |
306 |
|
3 |
Algeria |
1247404 |
176044 |
12.80 |
|
3 |
Egypt |
299 |
|
4 |
Iran |
1030460 |
122332 |
10.57 |
|
4 |
Türkiye |
160 |
|
5 |
Pakistan |
732936 |
102081 |
7.52 |
|
5 |
Oman |
145 |
|
6 |
Iraq |
715293 |
278159 |
7.34 |
|
6 |
China |
132 |
|
7 |
Sudan |
442667 |
37046 |
4.54 |
|
7 |
Qatar |
122 |
|
8 |
UAE |
397329 |
40739 |
4.08 |
|
8 |
Sudan |
121 |
|
9 |
Oman |
376980 |
26355 |
3.87 |
|
9 |
Israel |
119 |
|
10 |
Tunisia |
369000 |
77805 |
3.79 |
|
10 |
Palestine |
112 |
|
11 |
Libya |
187870 |
34644 |
1.93 |
|
11 |
Saudi Arabia |
104 |
|
12 |
China |
161121 |
12382 |
1.65 |
|
12 |
UAE |
99 |
|
13 |
Morocco |
137394 |
65432 |
1.41 |
|
13 |
Mali |
94 |
|
14 |
Kuwait |
103112 |
3404 |
1.06 |
|
14 |
USA |
94 |
|
15 |
Türkiye |
97560 |
6152 |
1.00 |
|
15 |
Iran |
85 |
|
Total Top 15 Countries |
9343289 |
1197592 |
95.85 |
|
Source: FAO |
|
|
|
|
Total Other 23 Countries |
404281 |
72693 |
4.15 |
|
|
|
|
|
|
World Total |
9747570 |
1270285 |
100.00 |
|
|
|
|
|
|
Source: FAO |
|
|
|
|
|
|
|
|
<hr size=2 width="100%" align=center>
Sheet 44: Dates Graph
|
|
|
![]()
Sheet 45: Dates Yield
|
|
|
![]()
Sheet 46: Mango
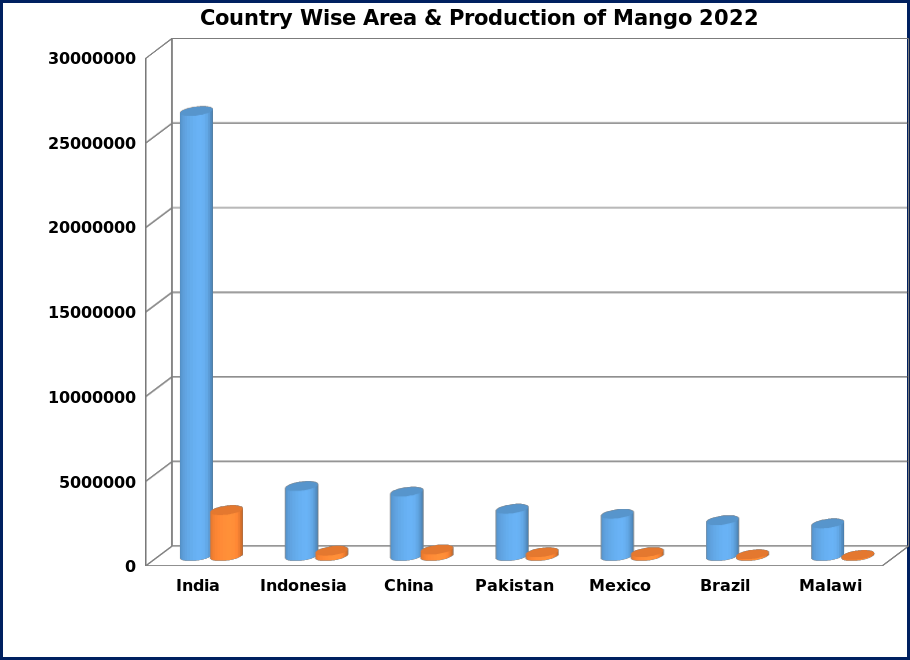
|
Country Wise Area
& Production of Mango & Guava 2022 |
|
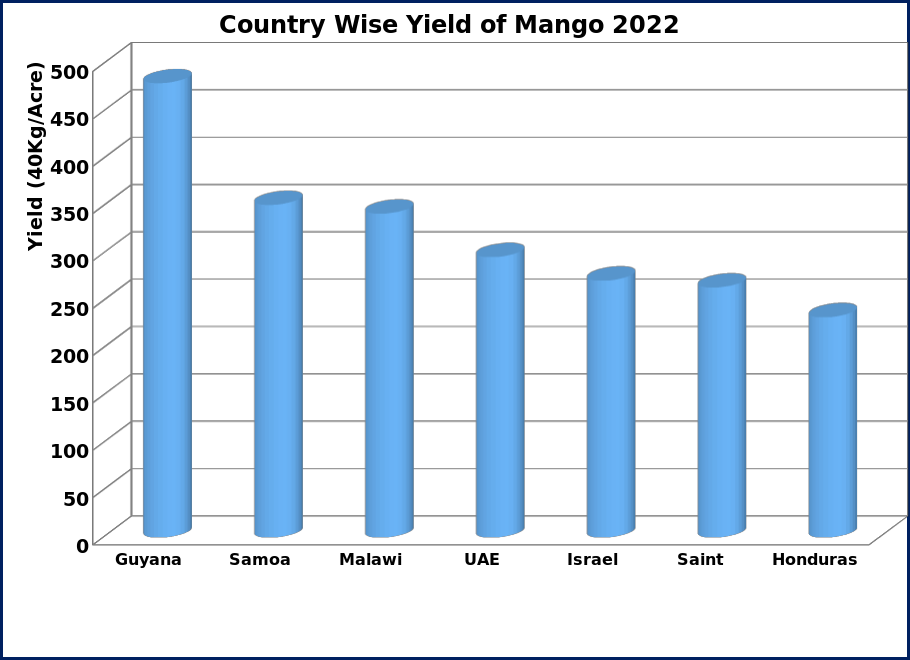
Country Wise Yield of
Mango 2022 |
||||||
|
Sr. No. |
Countries |
Production (Tons) |
Area
(Hectares) |
%age Share |
|
Sr. No. |
Countries |
40Kg/Acre |
|
1 |
India |
26299000 |
2704000 |
44.46 |
|
1 |
Guyana |
480 |
|
2 |
Indonesia |
4125244 |
303413 |
6.97 |
|
2 |
Samoa |
351 |
|
3 |
China |
3800000 |
381000 |
6.42 |
|
3 |
Malawi |
342 |
|
4 |
Pakistan |
2782809 |
213639 |
4.70 |
|
4 |
UAE |
296 |
|
5 |
Mexico |
2485546 |
221858 |
4.20 |
|
5 |
Israel |
271 |
|
6 |
Brazil |
2111139 |
100663 |
3.57 |
|
6 |
Saint |
264 |
|
7 |
Malawi |
1916502 |
56684 |
3.24 |
|
7 |
Honduras |
233 |
|
8 |
Bangladesh |
1452303 |
139132 |
2.46 |
|
8 |
USA |
217 |
|
9 |
Viet Nam |
1443572 |
118943 |
2.44 |
|
9 |
Brazil |
212 |
|
10 |
Thailand |
1398902 |
144776 |
2.36 |
|
10 |
Sudan |
207 |
|
11 |
Nigeria |
940397 |
131204 |
1.59 |
|
11 |
South Africa |
196 |
|
12 |
Egypt |
890338 |
110337 |
1.51 |
|
12 |
Trinidad and Tobago |
186 |
|
13 |
Kenya |
758372 |
66234 |
1.28 |
|
13 |
Bahamas |
181 |
|
14 |
Philippines |
723093 |
192503 |
1.22 |
|
14 |
Democratic Republic of the Congo |
171 |
|
15 |
Sudan |
717821 |
35036 |
1.21 |
|
15 |
Yemen |
163 |
|
Total Top 15 Countries |
51845038 |
4919422 |
87.65 |
|
Source: FAO |
|
|
|
|
Total Other 83 Countries |
7306785 |
1090303 |
12.35 |
|
|
|
|
|
|
World Total |
59151823 |
6009725 |
100.00 |
|
|
|
|
|
|
Source: FAO |
|
|
|
|
|
|
|
|
<hr size=2 width="100%" align=center>
Sheet 47: Mango Graph
|
|
|
![]()
Sheet 48: Mango Yield
|
|
|
![]()
Sheet 49: Lemon & Lime
|
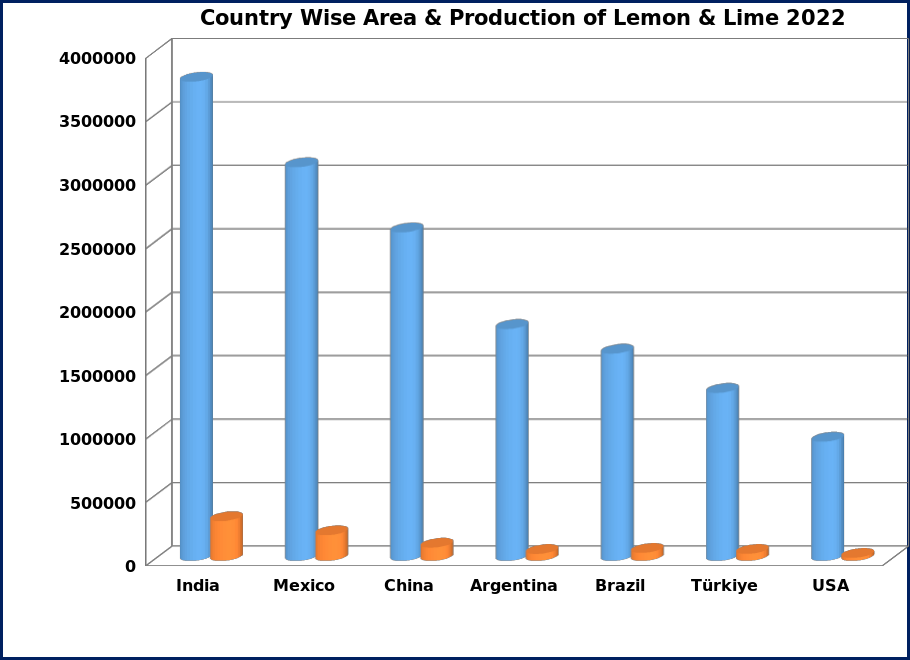
Country Wise Area
& Production of Lemon & Lime 2022 |
|
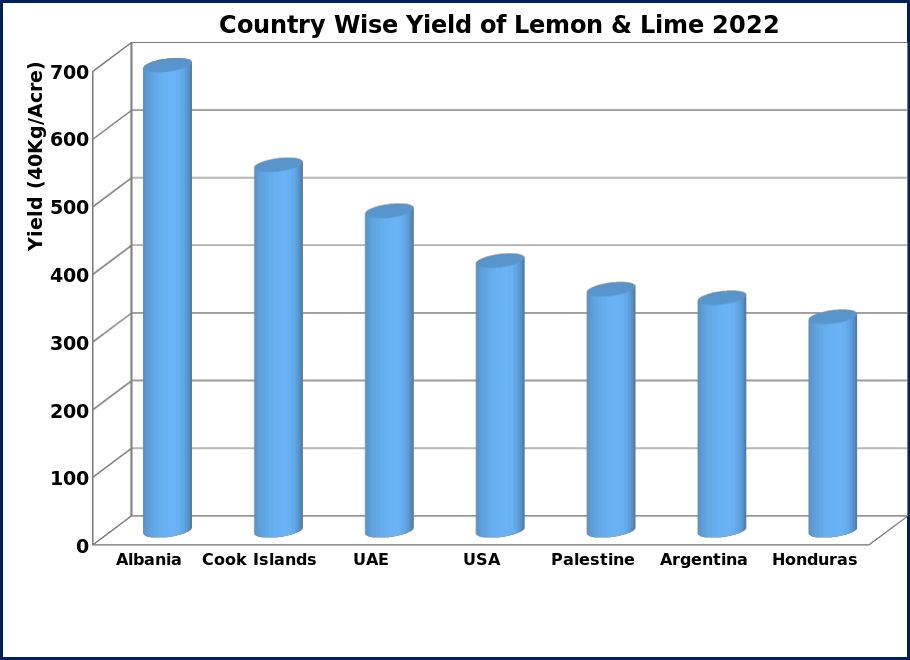
Country Wise Yield of
Lemon & Lime 2022 |
||||||
|
Sr. No. |
Countries |
Production (Tons) |
Area
(Hectares) |
%age Share |
|
Sr. No. |
Countries |
40Kg/Acre |
|
1 |
India |
3776000 |
313000 |
17.54 |
|
1 |
Albania |
688 |
|
2 |
Mexico |
3102046 |
201998 |
14.41 |
|
2 |
Cook Islands |
541 |
|
3 |
China |
2588549 |
103469 |
12.02 |
|
3 |
UAE |
472 |
|
4 |
Argentina |
1826356 |
53742 |
8.48 |
|
4 |
USA |
399 |
|
5 |
Brazil |
1632109 |
62867 |
7.58 |
|
5 |
Palestine |
356 |
|
6 |
Türkiye |
1323000 |
55246 |
6.15 |
|
6 |
Argentina |
344 |
|
7 |
USA |
938030 |
23796 |
4.36 |
|
7 |
Honduras |
316 |
|
8 |
Spain |
863240 |
52570 |
4.01 |
|
8 |
Guyana |
312 |
|
9 |
South Africa |
779335 |
35273 |
3.62 |
|
9 |
Israel |
298 |
|
10 |
Iran |
508349 |
28636 |
2.36 |
|
10 |
Lebanon |
294 |
|
11 |
Italy |
476310 |
24560 |
2.21 |
|
11 |
Uruguay |
286 |
|
12 |
Sudan |
376112 |
32772 |
1.75 |
|
12 |
Chile |
277 |
|
13 |
Egypt |
357621 |
16986 |
1.66 |
|
13 |
Saint Vincent and the Grenadines |
264 |
|
14 |
Peru |
344266 |
28121 |
1.60 |
|
14 |
Brazil |
263 |
|
15 |
Chile |
225041 |
8225 |
1.05 |
|
15 |
China |
253 |
|
Total Top 15 Countries |
19116363 |
1041261 |
88.79 |
|
Source: FAO |
|
|
|
|
Total Other 92 Countries |
2413241 |
292996 |
11.21 |
|
|
|
|
|
|
World Total |
21529604 |
1334257 |
100.00 |
|
|
|
|
|
|
Source: FAO |
|
|
|
|
|
|
|
|
<hr size=2 width="100%" align=center>
Sheet 50: Lemon & Lime Graph
|
|
|
![]()
Sheet 51: Lemon & Lime Yield
|
|
|
![]()
Sheet 52: Orange
|
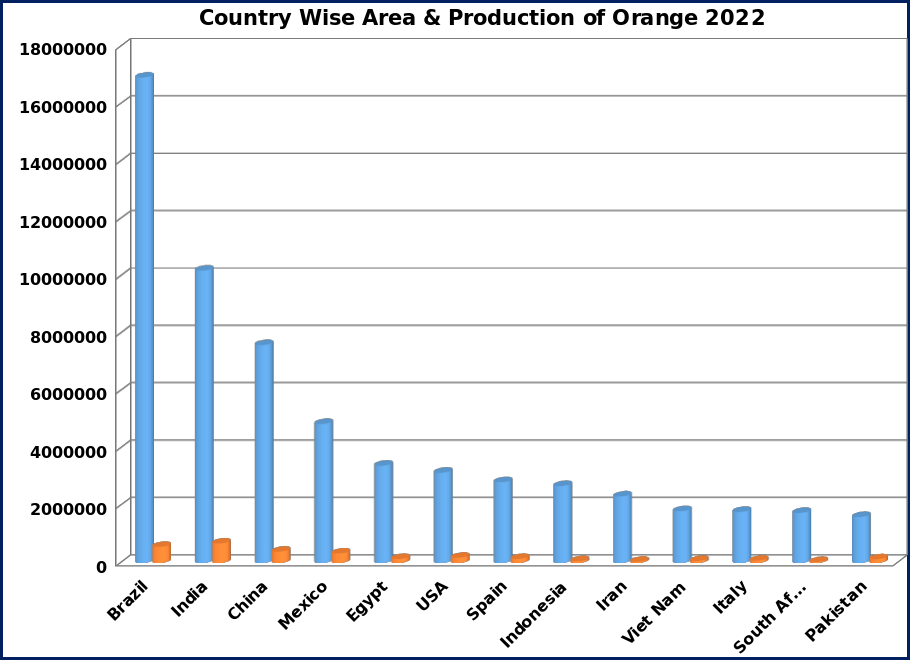
Country Wise Area
& Production of Orange 2022 |
|
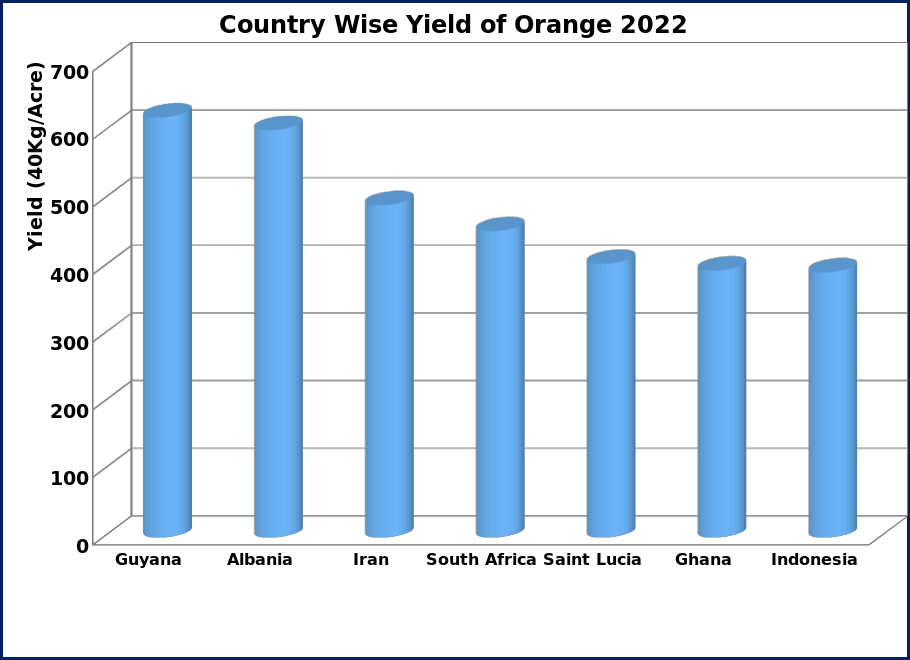
Country Wise Yield of
Orange 2022 |
||||||
|
Sr. No. |
Countries |
Production (Tons) |
Area
(Hectares) |
%age Share |
|
Sr. No. |
Countries |
40Kg/Acre |
|
1 |
Brazil |
16929631 |
568132 |
22.16 |
|
1 |
Guyana |
621 |
|
2 |
India |
10198000 |
683000 |
13.35 |
|
2 |
Albania |
603 |
|
3 |
China |
7600000 |
398524 |
9.95 |
|
3 |
Iran |
491 |
|
4 |
Mexico |
4850083 |
335541 |
6.35 |
|
4 |
South Africa |
453 |
|
5 |
Egypt |
3392819 |
143376 |
4.44 |
|
5 |
Saint Lucia |
405 |
|
6 |
USA |
3148840 |
187614 |
4.12 |
|
6 |
Ghana |
395 |
|
7 |
Spain |
2817400 |
144200 |
3.69 |
|
7 |
Indonesia |
392 |
|
8 |
Indonesia |
2684978 |
69271 |
3.51 |
|
8 |
Saint Vincent and the Grenadines |
364 |
|
9 |
Iran |
2321124 |
47779 |
3.04 |
|
9 |
Guatemala |
327 |
|
10 |
Viet Nam |
1807859 |
75250 |
2.37 |
|
10 |
Honduras |
310 |
|
11 |
Italy |
1783110 |
84770 |
2.33 |
|
11 |
Greece |
308 |
|
12 |
South Africa |
1747778 |
39030 |
2.29 |
|
12 |
Paraguay |
302 |
|
13 |
Pakistan |
1605294 |
133810 |
2.10 |
|
13 |
Brazil |
301 |
|
14 |
Türkiye |
1322000 |
49536 |
1.73 |
|
14 |
Tunisia |
274 |
|
15 |
Morocco |
1248308 |
60580 |
1.63 |
|
15 |
Lebanon |
272 |
|
Total Top 15 Countries |
63457224 |
3020413 |
83.05 |
|
Source: FAO |
|
|
|
|
Total Other 102 Countries |
12952813 |
956158 |
16.95 |
|
|
|
|
|
|
World Total |
76410037 |
3976571 |
100.00 |
|
|
|
|
|
|
Source: FAO |
|
|
|
|
|
|
|
|
<hr size=2 width="100%" align=center>
Sheet 53: Orange Graph
|
|
|
![]()
Sheet 54: Orange Yield
|
|
|
![]()
Sheet 55: Other Citrus
|
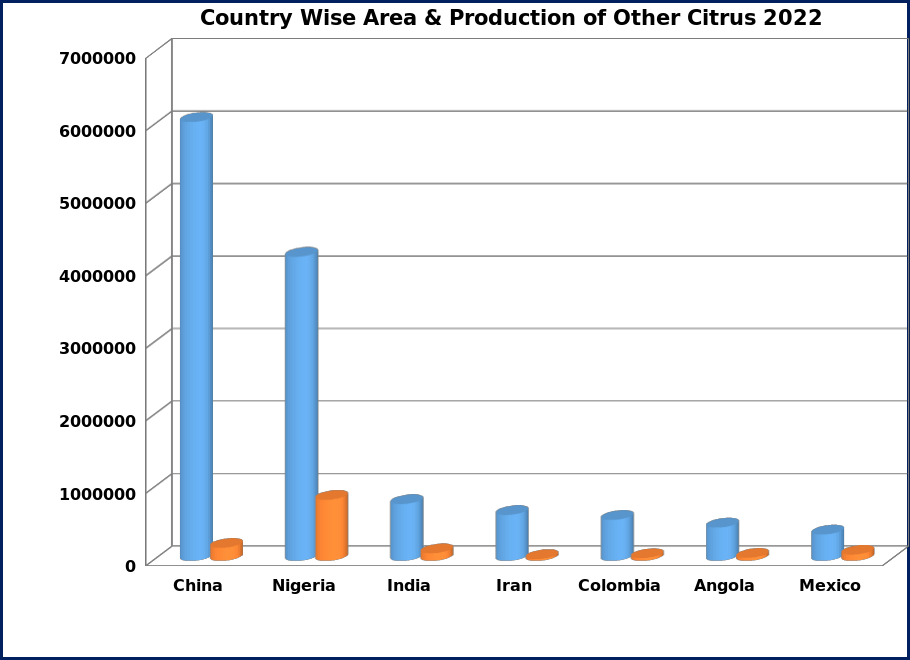
Country Wise Area
& Production of Other Citrus 2022 |
|
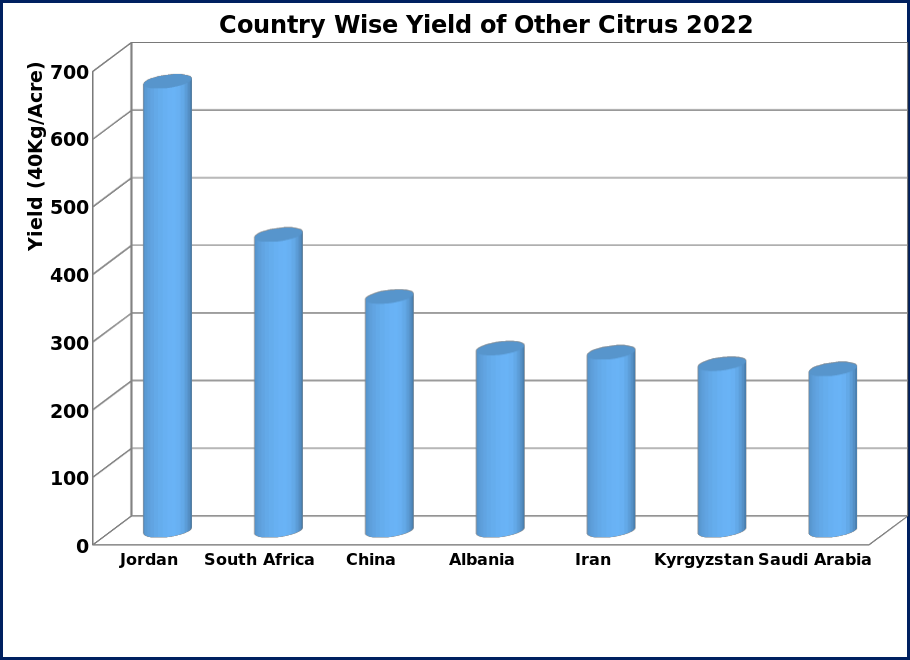
Country Wise Yield of
Other Citrus 2022 |
||||||
|
Sr. No. |
Countries |
Production (Tons) |
Area
(Hectares) |
%age Share |
|
Sr. No. |
Countries |
40Kg/Acre |
|
1 |
China |
6051685 |
179677 |
41.96 |
|
1 |
Jordan |
664 |
|
2 |
Nigeria |
4192296 |
840890 |
29.07 |
|
2 |
South Africa |
437 |
|
3 |
India |
782000 |
103000 |
5.42 |
|
3 |
China |
346 |
|
4 |
Iran |
631270 |
24258 |
4.38 |
|
4 |
Albania |
269 |
|
5 |
Colombia |
563566 |
37527 |
3.91 |
|
5 |
Iran |
263 |
|
6 |
Angola |
458147 |
39804 |
3.18 |
|
6 |
Kyrgyzstan |
246 |
|
7 |
Mexico |
361087 |
84371 |
2.50 |
|
7 |
Saudi Arabia |
239 |
|
8 |
Guinea |
240551 |
44432 |
1.67 |
|
8 |
USA |
204 |
|
9 |
Tunisia |
141703 |
13544 |
0.98 |
|
9 |
French Polynesia |
199 |
|
10 |
Saudi Arabia |
122400 |
5189 |
0.85 |
|
10 |
Japan |
185 |
|
11 |
Sierra Leone |
112766 |
19804 |
0.78 |
|
11 |
Peru |
185 |
|
12 |
Philippines |
107896 |
19442 |
0.75 |
|
12 |
Italy |
181 |
|
13 |
Kenya |
90628 |
13180 |
0.63 |
|
13 |
UAE |
178 |
|
14 |
Guatemala |
68974 |
13076 |
0.48 |
|
14 |
Uzbekistan |
171 |
|
15 |
Peru |
66434 |
3639 |
0.46 |
|
15 |
Kazakhstan |
158 |
|
Total Top 15 Countries |
13991404 |
1441833 |
97.01 |
|
Source: FAO |
|
|
|
|
Total Other 47 Countries |
430790 |
62700 |
2.99 |
|
|
|
|
|
|
World Total |
14422194 |
1504533 |
100.00 |
|
|
|
|
|
|
Source: FAO |
|
|
|
|
|
|
|
|
<hr size=2 width="100%" align=center>
Sheet 56: Other Citrus Graph
|
|
|
![]()
Sheet 57: Other Citrus Yield
|
|
|
![]()
Sheet 58: Grapefruit
|
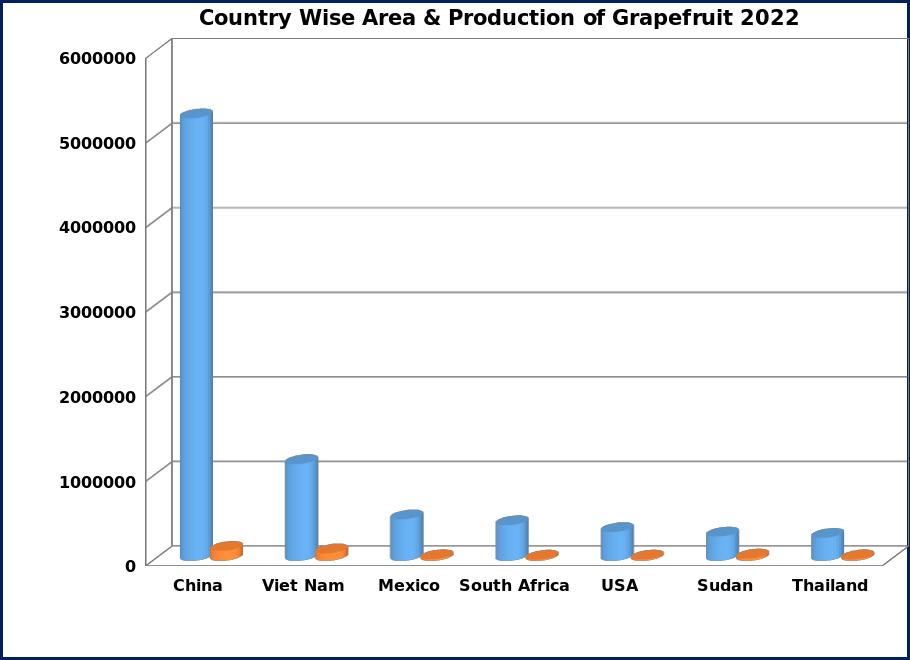
Country Wise Area
& Production of Grapefruit 2022 |
|
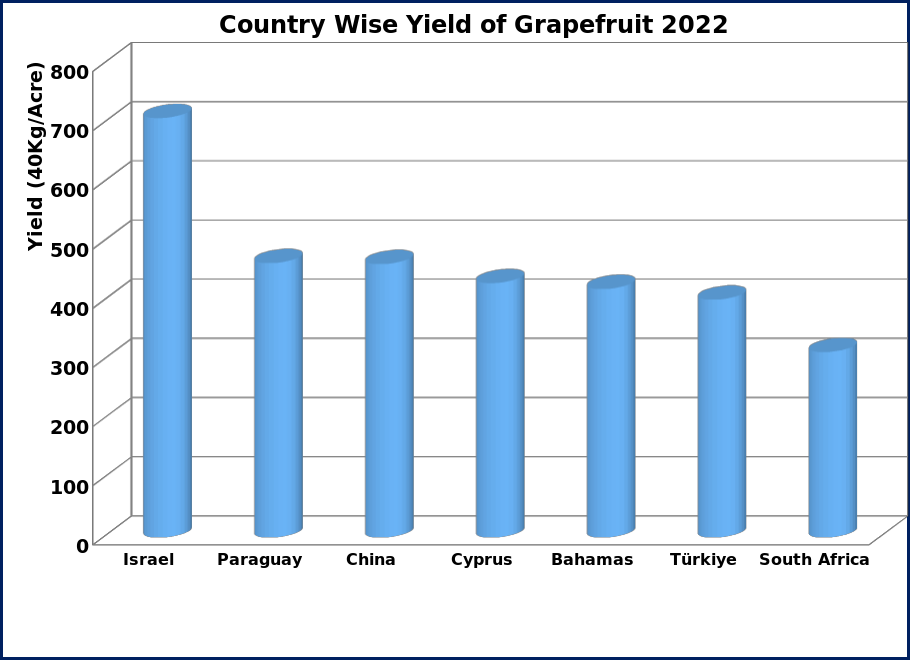
Country Wise Yield of
Grapefruit 2022 |
||||||
|
Sr. No. |
Countries |
Production (Tons) |
Area
(Hectares) |
%age Share |
|
Sr. No. |
Countries |
40Kg/Acre |
|
1 |
China |
5231792 |
117271 |
53.59 |
|
1 |
Israel |
709 |
|
2 |
Viet Nam |
1142581 |
87921 |
11.70 |
|
2 |
Paraguay |
464 |
|
3 |
Mexico |
489101 |
20412 |
5.01 |
|
3 |
China |
462 |
|
4 |
South Africa |
420176 |
13565 |
4.30 |
|
4 |
Cyprus |
430 |
|
5 |
USA |
339290 |
14933 |
3.48 |
|
5 |
Bahamas |
420 |
|
6 |
Sudan |
286307 |
26987 |
2.93 |
|
6 |
Türkiye |
402 |
|
7 |
Thailand |
270525 |
18064 |
2.77 |
|
7 |
South Africa |
313 |
|
8 |
Türkiye |
198000 |
4982 |
2.03 |
|
8 |
Puerto Rico |
309 |
|
9 |
Israel |
176638 |
2521 |
1.81 |
|
9 |
Palestine |
305 |
|
10 |
Syria |
163981 |
9619 |
1.68 |
|
10 |
Jamaica |
269 |
|
11 |
Tunisia |
102424 |
4715 |
1.05 |
|
11 |
Argentina |
255 |
|
12 |
Iran |
88687 |
3661 |
0.91 |
|
12 |
Algeria |
255 |
|
13 |
Argentina |
85300 |
3378 |
0.87 |
|
13 |
Saint Lucia |
253 |
|
14 |
Brazil |
83686 |
4535 |
0.86 |
|
14 |
New Zealand |
252 |
|
15 |
Spain |
76660 |
3240 |
0.79 |
|
15 |
Iran |
245 |
|
Total Top 15 Countries |
9155148 |
335804 |
93.79 |
|
Source: FAO |
|
|
|
|
Total Other 60 Countries |
606607 |
57901 |
6.21 |
|
|
|
|
|
|
World Total |
9761755 |
393705 |
100.00 |
|
|
|
|
|
|
Source: FAO |
|
|
|
|
|
|
|
|
<hr size=2 width="100%" align=center>
Sheet 59: Grapefruit Graph
|
|
|
![]()
Sheet 60: Grapefruit Yield
|
|
|
![]()
Sheet 61: Tangerine & M.rine
|
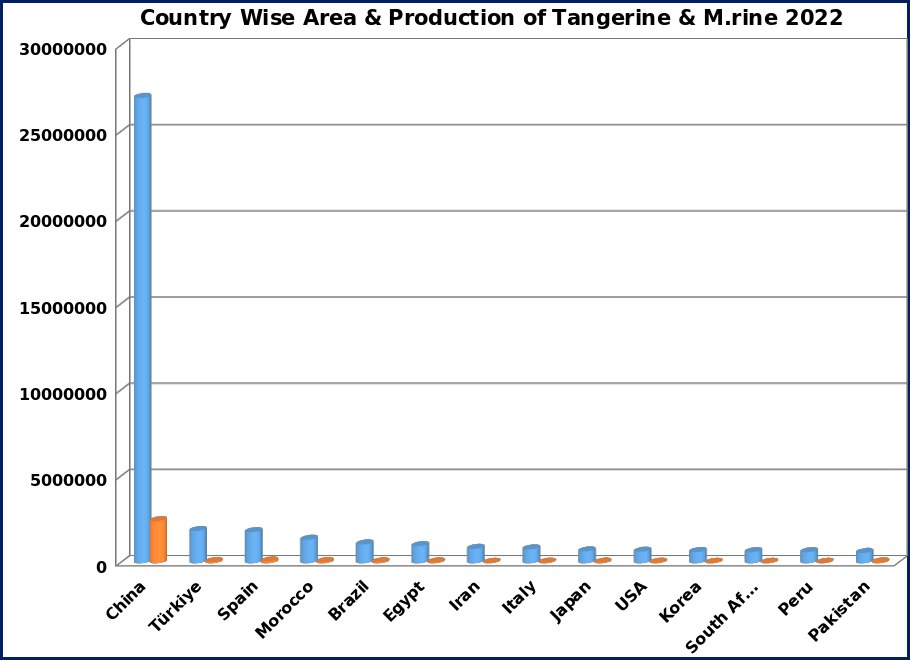
Country Wise Area
& Production of Tangerine & M.rine 2022 |
|
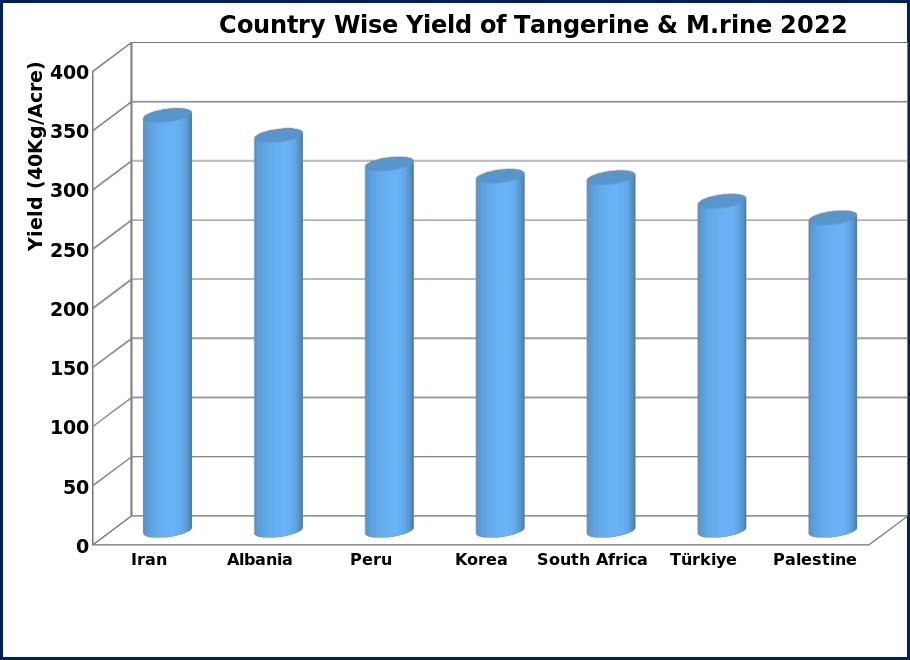
Country Wise Yield of
Tangerine & M.rine 2022 |
||||||
|
Sr. No. |
Countries |
Production (Tons) |
Area
(Hectares) |
%age Share |
|
Sr. No. |
Countries |
40Kg/Acre |
|
1 |
China |
27000000 |
2435363 |
61.11 |
|
1 |
Iran |
351 |
|
2 |
Türkiye |
1865000 |
67854 |
4.22 |
|
2 |
Albania |
334 |
|
3 |
Spain |
1800490 |
97530 |
4.08 |
|
3 |
Peru |
310 |
|
4 |
Morocco |
1360965 |
63294 |
3.08 |
|
4 |
Korea |
299 |
|
5 |
Brazil |
1086616 |
56357 |
2.46 |
|
5 |
South Africa |
298 |
|
6 |
Egypt |
989041 |
47728 |
2.24 |
|
6 |
Türkiye |
278 |
|
7 |
Iran |
829529 |
23927 |
1.88 |
|
7 |
Palestine |
264 |
|
8 |
Italy |
801240 |
34710 |
1.81 |
|
8 |
Lebanon |
251 |
|
9 |
Japan |
682200 |
36200 |
1.54 |
|
9 |
French Polynesia |
250 |
|
10 |
USA |
664060 |
30837 |
1.50 |
|
10 |
Azerbaijan |
244 |
|
11 |
Korea |
650472 |
21987 |
1.47 |
|
11 |
Australia |
241 |
|
12 |
South Africa |
639000 |
21682 |
1.45 |
|
12 |
Paraguay |
240 |
|
13 |
Peru |
638845 |
20865 |
1.45 |
|
13 |
Italy |
234 |
|
14 |
Pakistan |
595849 |
50311 |
1.35 |
|
14 |
France |
220 |
|
15 |
Mexico |
515084 |
36270 |
1.17 |
|
15 |
Syria |
220 |
|
Total Top 15 Countries |
40118391 |
3044915 |
90.81 |
|
Source: FAO |
|
|
|
|
Total Other 54 Countries |
4061440 |
298979 |
9.19 |
|
|
|
|
|
|
World Total |
44179831 |
3343894 |
100.00 |
|
|
|
|
|
|
Source: FAO |
|
|
|
|
|
|
|
|
<hr size=2 width="100%" align=center>
Sheet 62: Tangerine & M.rine Graph
|
|
|
![]()
Sheet 63: Tangerine & M.rine Yield
|
|
|
![]()
Sheet 64: Ground Nut
|
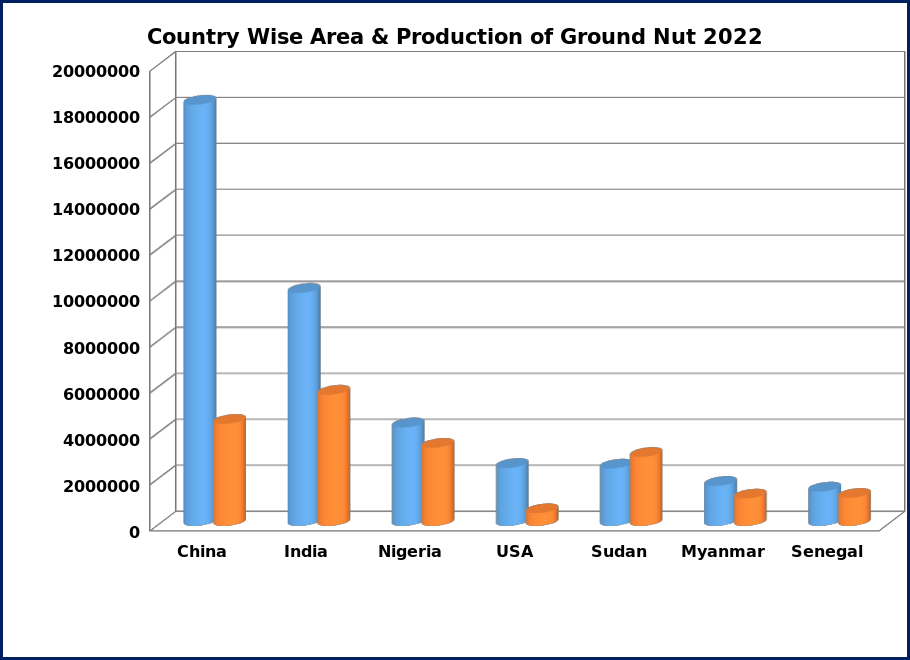
Country Wise Area
& Production of Ground Nut 2022 |
|
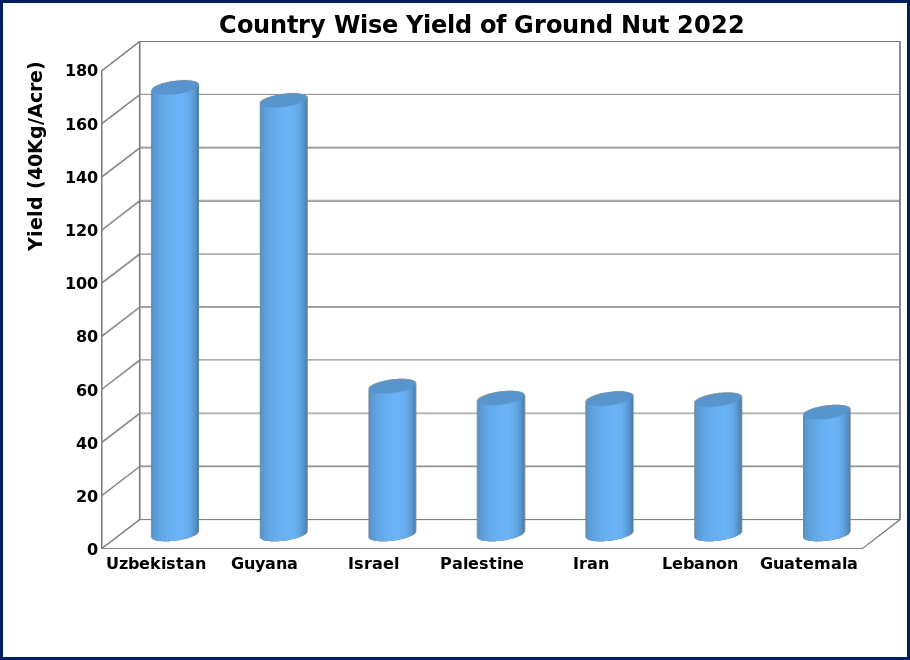
Country Wise Yield of
Ground Nut 2022 |
||||||
|
Sr. No. |
Countries |
Production (Tons) |
Area
(Hectares) |
%age Share |
|
Sr. No. |
Countries |
40Kg/Acre |
|
1 |
China |
18329500 |
4440000 |
33.79 |
|
1 |
Uzbekistan |
168 |
|
2 |
India |
10134990 |
5704740 |
18.69 |
|
2 |
Guyana |
163 |
|
3 |
Nigeria |
4284000 |
3400000 |
7.90 |
|
3 |
Israel |
56 |
|
4 |
USA |
2525670 |
560660 |
4.66 |
|
4 |
Palestine |
51 |
|
5 |
Sudan |
2500000 |
3000000 |
4.61 |
|
5 |
Iran |
51 |
|
6 |
Myanmar |
1741378 |
1194161 |
3.21 |
|
6 |
Lebanon |
51 |
|
7 |
Senegal |
1501498 |
1225172 |
2.77 |
|
7 |
Guatemala |
46 |
|
8 |
Argentina |
1346166 |
406477 |
2.48 |
|
8 |
Nicaragua |
46 |
|
9 |
Guinea |
1025144 |
854287 |
1.89 |
|
9 |
USA |
46 |
|
10 |
Brazil |
848194 |
220382 |
1.56 |
|
10 |
Tajikistan |
43 |
|
11 |
Chad |
829431 |
762642 |
1.53 |
|
11 |
China |
42 |
|
12 |
Tanzania |
710000 |
1020000 |
1.31 |
|
12 |
Türkiye |
41 |
|
13 |
Niger |
670613 |
1003762 |
1.24 |
|
13 |
Saudi Arabia |
41 |
|
14 |
Ghana |
611000 |
370000 |
1.13 |
|
14 |
Brazil |
39 |
|
15 |
Central African Republic |
574467 |
193031 |
1.06 |
|
15 |
Iraq |
35 |
|
Total Top 15 Countries |
47632051 |
24355314 |
87.82 |
|
Source: FAO |
|
|
|
|
34 |
Pakistan |
114385 |
129224 |
0.21 |
|
|
|
|
|
Total Other 93 Countries |
6492124 |
6051724 |
11.97 |
|
|
|
|
|
|
World Total |
54238560 |
30536262 |
100.00 |
|
|
|
|
|
|
Source: FAO |
|
|
|
|
|
|
|
|
<hr size=2 width="100%" align=center>
Sheet 65: Ground Nut Graph
|
|
|

Sheet 66: Ground Nut Yield
|
|
|
![]()