Sheet 1: Wheat
|
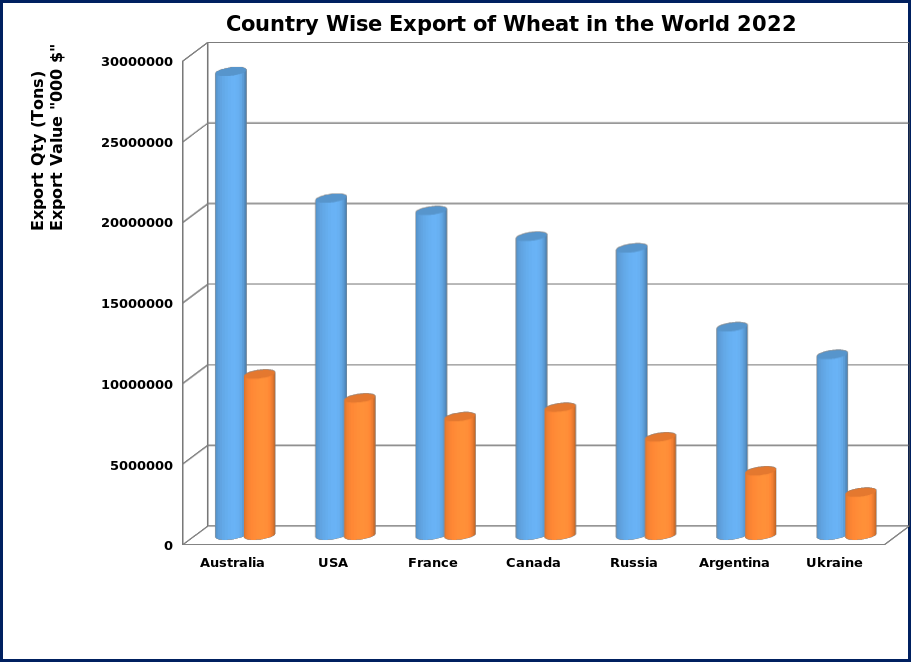
Country Wise Export of
Wheat in the World Year 2022 |
|
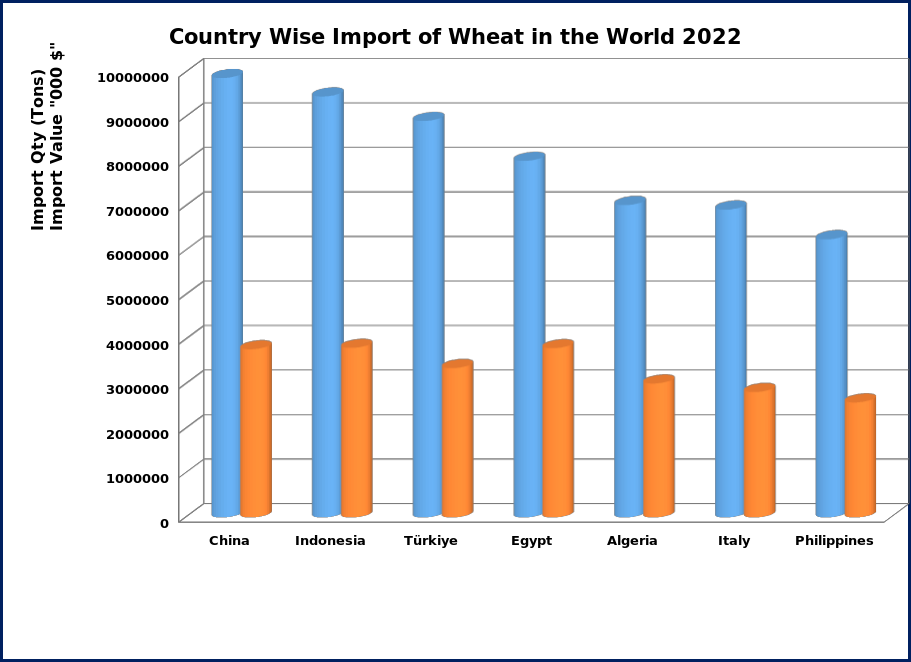
Country Wise Import of
Wheat in the World Year 2022 |
||||||
|
Sr. No. |
Countries |
Export Qty. in Tons |
Export Value in 000 $ |
|
Sr. No. |
Countries |
Import Qty. in Tons |
Import Value in 000 $ |
|
1 |
Australia |
28781090 |
10008195 |
|
1 |
China |
9873100 |
3779735 |
|
2 |
USA |
20917589 |
8522976 |
|
2 |
Indonesia |
9459252 |
3810400 |
|
3 |
France |
20151547 |
7358185 |
|
3 |
Türkiye |
8907417 |
3355956 |
|
4 |
Canada |
18548392 |
7944968 |
|
4 |
Egypt |
8010427 |
3803009 |
|
5 |
Russia |
17829424 |
6101368 |
|
5 |
Algeria |
7017241 |
3010163 |
|
6 |
Argentina |
12938182 |
4000808 |
|
6 |
Italy |
6916967 |
2818061 |
|
7 |
Ukraine |
11223216 |
2678054 |
|
7 |
Philippines |
6250777 |
2584090 |
|
8 |
India |
6798598 |
2130739 |
|
8 |
Morocco |
6007647 |
2548888 |
|
9 |
Kazakhstan |
6345733 |
1920362 |
|
9 |
Brazil |
5716592 |
2264152 |
|
10 |
Germany |
6221620 |
2224216 |
|
10 |
Japan |
5346036 |
2507636 |
|
11 |
Romania |
5684673 |
2076086 |
|
11 |
Spain |
4926807 |
1830157 |
|
12 |
Bulgaria |
4051292 |
1455375 |
|
12 |
Nigeria |
4915826 |
2044740 |
|
13 |
Poland |
3637950 |
1405318 |
|
13 |
Korea |
4405846 |
1786753 |
|
14 |
Brazil |
3072779 |
967323 |
|
14 |
Bangladesh |
4169796 |
1592061 |
|
15 |
Lithuania |
2959198 |
1033513 |
|
15 |
Germany |
4112490 |
1477716 |
|
Total of Top 15 Countries |
169161285 |
59827486 |
|
Total of Top 15 Countries |
96036220 |
39213517 |
||
|
Total of 88 Other Countries |
17518602 |
6525595 |
|
22 |
Pakistan |
2336609 |
943376 |
|
|
World Total |
186679887 |
66353081 |
|
Total of 162 Other Countries |
86425341 |
33927716 |
||
|
Source: FAO |
|
|
|
|
World Total |
184798170 |
74084609 |
|
|
|
|
|
|
|
Source: FAO |
|
|
|
Sheet 2: Export of Wheat
|
|
|
![]()
Sheet 3: Import of Wheat
|
|
|
![]()
Sheet 4: Maize (corn)
|
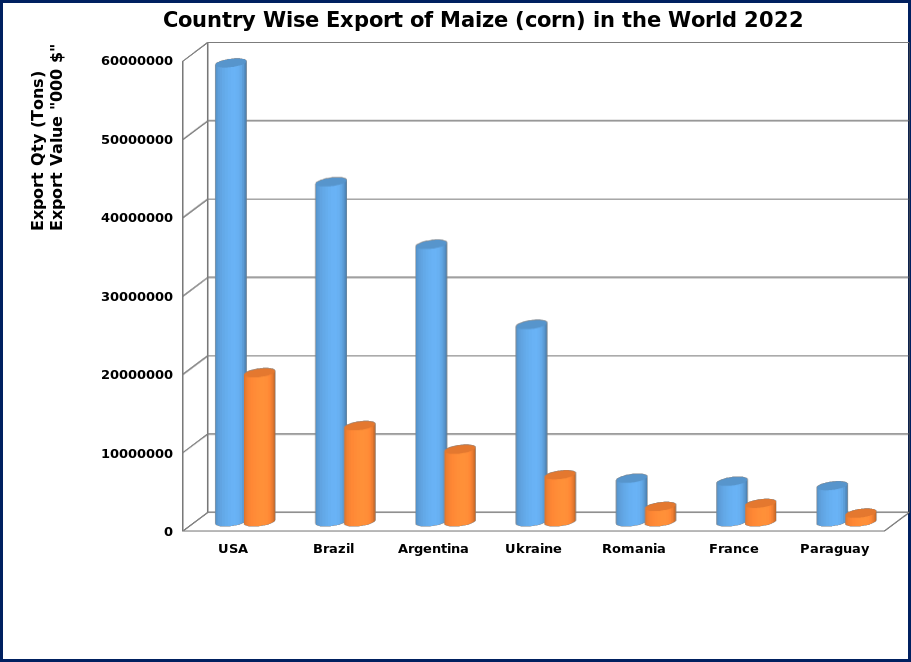
Country Wise Export of
Maize in the World Year 2022 |
|
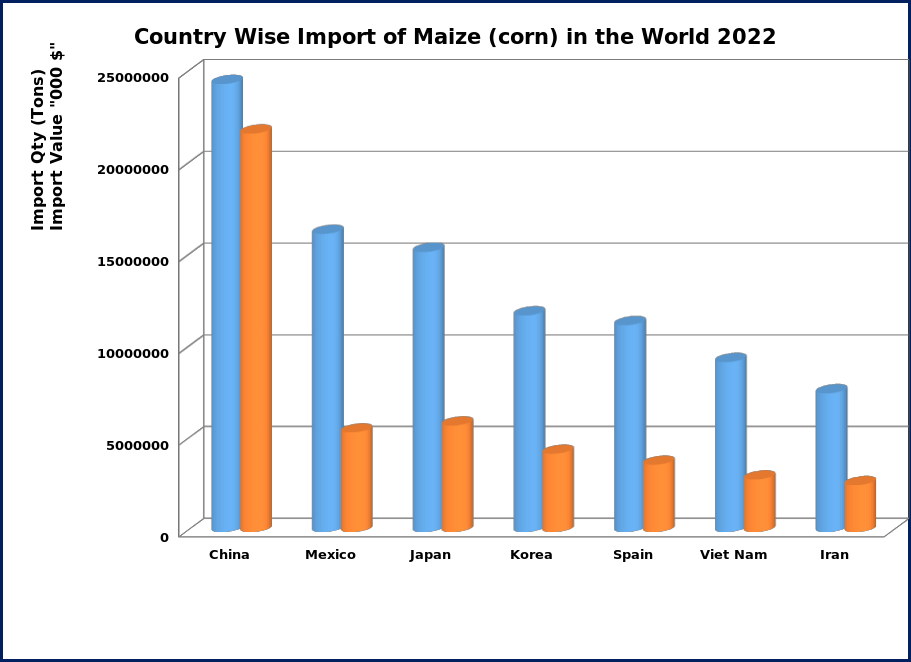
Country Wise Import of
Maize in the World Year 2022 |
||||||
|
Sr. No. |
Countries |
Export Qty. in Tons |
Export Value in 000 $ |
|
Sr. No. |
Countries |
Import Qty. in Tons |
Import Value in 000 $ |
|
1 |
USA |
58595339 |
19031565 |
|
1 |
China |
24425758 |
21725413 |
|
2 |
Brazil |
43389331 |
12264070 |
|
2 |
Mexico |
16255847 |
5436828 |
|
3 |
Argentina |
35409336 |
9260947 |
|
3 |
Japan |
15271341 |
5812556 |
|
4 |
Ukraine |
25176653 |
5992448 |
|
4 |
Korea |
11809941 |
4273925 |
|
5 |
Romania |
5539733 |
1954566 |
|
5 |
Spain |
11277720 |
3675345 |
|
6 |
France |
5156373 |
2346255 |
|
6 |
Viet Nam |
9267578 |
2869133 |
|
7 |
Paraguay |
4598421 |
1088661 |
|
7 |
Iran |
7566301 |
2561740 |
|
8 |
South Africa |
3918752 |
1213809 |
|
8 |
Italy |
6910114 |
2305087 |
|
9 |
Poland |
3881044 |
1288721 |
|
9 |
Colombia |
6529081 |
2164919 |
|
10 |
India |
3486496 |
1118312 |
|
10 |
Egypt |
6379971 |
2500913 |
|
11 |
Russia |
2114951 |
628878 |
|
11 |
Netherlands |
5268696 |
1780370 |
|
12 |
Canada |
2080947 |
699845 |
|
12 |
Canada |
4875664 |
1453942 |
|
13 |
Hungary |
1994683 |
874124 |
|
13 |
Saudi Arabia |
4597207 |
1456581 |
|
14 |
Myanmar |
1550004 |
658382 |
|
14 |
Algeria |
3807287 |
1106942 |
|
15 |
Serbia |
1250061 |
431964 |
|
15 |
Peru |
3583019 |
1292662 |
|
Total of Top 15 Countries |
198142125 |
58852547 |
|
Total of Top 15 Countries |
137825525 |
60416356 |
||
|
20 |
Pakistan |
797186 |
260572 |
|
113 |
Pakistan |
34592 |
87628 |
|
Total of 113 Other Countries |
10524716 |
4213372 |
|
Total of 175 Other Countries |
63917058 |
10341911 |
||
|
World Total |
209464028 |
63326491 |
|
World Total |
201777175 |
70845895 |
||
|
Source: FAO |
|
|
|
|
Source: FAO |
|
|
|
Sheet 5: Export of Maize (corn)
|
|
|
![]()
Sheet 6: Import of Maize (corn)
|
|
|
![]()
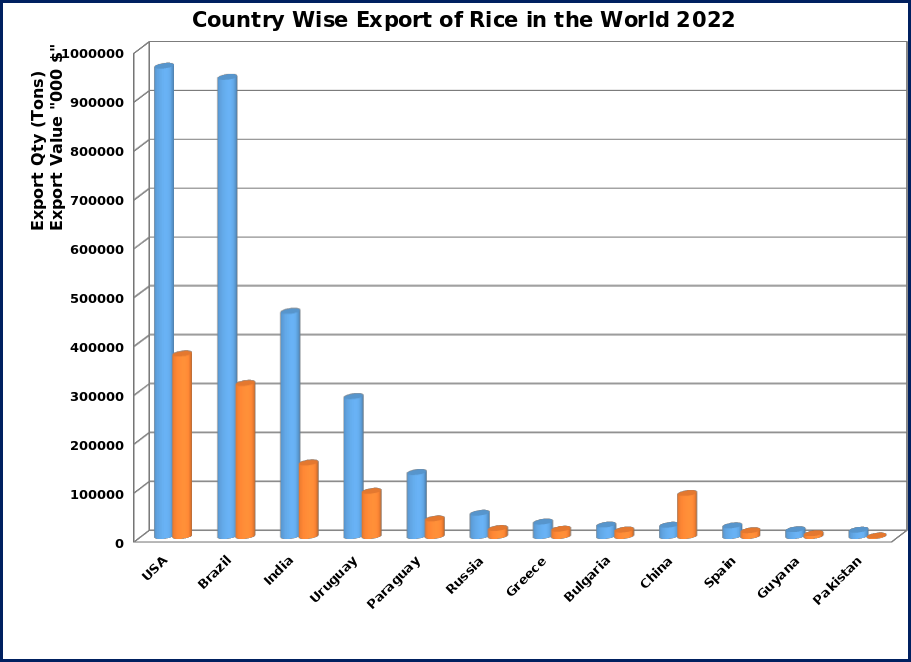
Sheet 7: Rice
|
Country Wise Export of
Rice in the World Year 2022 |
|
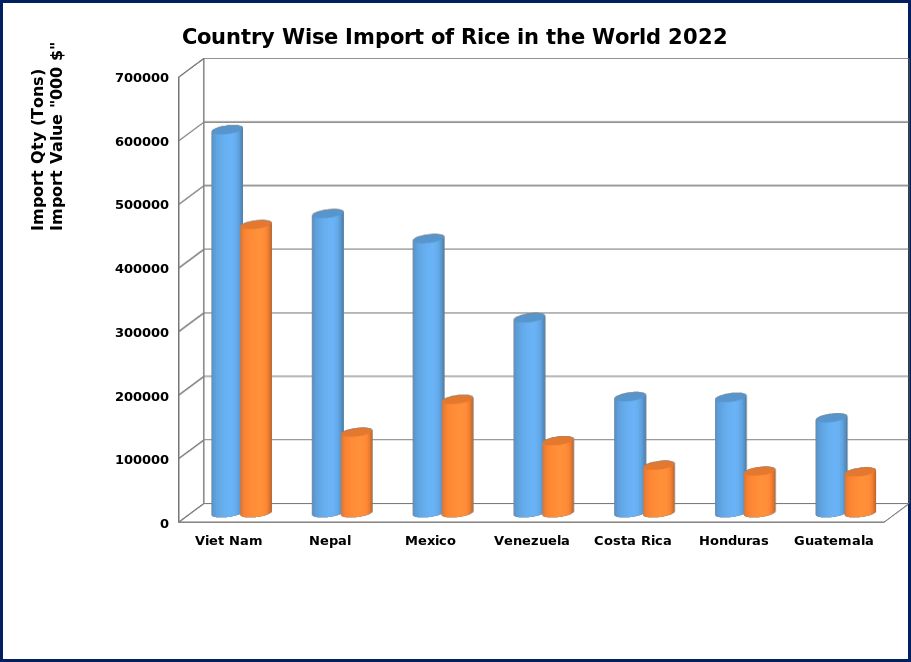
Country Wise Import of
Rice in the World Year 2022 |
||||||
|
Sr. No. |
Countries |
Export Qty. in Tons |
Export Value in 000 $ |
|
Sr. No. |
Countries |
Import Qty. in Tons |
Import Value in 000 $ |
|
1 |
USA |
962618 |
373591 |
|
1 |
Viet Nam |
602702 |
453469 |
|
2 |
Brazil |
939775 |
313260 |
|
2 |
Nepal |
470732 |
126936 |
|
3 |
India |
460635 |
150513 |
|
3 |
Mexico |
431427 |
178365 |
|
4 |
Uruguay |
286175 |
92493 |
|
4 |
Venezuela |
306680 |
113514 |
|
5 |
Paraguay |
130854 |
36018 |
|
5 |
Costa Rica |
182743 |
74890 |
|
6 |
Russia |
47600 |
16400 |
|
6 |
Honduras |
181525 |
65674 |
|
7 |
Greece |
29405 |
15045 |
|
7 |
Guatemala |
149513 |
64434 |
|
8 |
Bulgaria |
23403 |
13080 |
|
8 |
Colombia |
137691 |
60802 |
|
9 |
China |
22983 |
88062 |
|
9 |
Nicaragua |
101689 |
51876 |
|
10 |
Spain |
21817 |
11750 |
|
10 |
El Salvador |
98353 |
42378 |
|
11 |
Guyana |
13950 |
5718 |
|
11 |
Panama |
66282 |
31280 |
|
12 |
Pakistan |
13019 |
1289 |
|
12 |
Libya |
65624 |
24966 |
|
13 |
Myanmar |
12616 |
8813 |
|
13 |
Yemen |
56836 |
33670 |
|
14 |
Italy |
12193 |
12009 |
|
14 |
Brazil |
48903 |
14993 |
|
15 |
Tanzania |
10821 |
2513 |
|
15 |
Italy |
40619 |
27089 |
|
Total of Top 15 Countries |
2987866 |
1140554 |
|
Total of Top 15 Countries |
2941318 |
1364336 |
||
|
Total of 75 Other Countries |
63328 |
42126 |
|
21 |
Pakistan |
12076 |
39705 |
|
|
World Total |
3051194 |
1182680 |
|
Total of 137 Other Countries |
234759 |
195561 |
||
|
Source: FAO |
|
|
|
|
World Total |
3188153 |
1599602 |
|
|
|
|
|
|
|
Source: FAO |
|
|
|
Sheet 8: Export of Rice
|
|
|
![]()
Sheet 9: Import of Rice
|
|
|
![]()
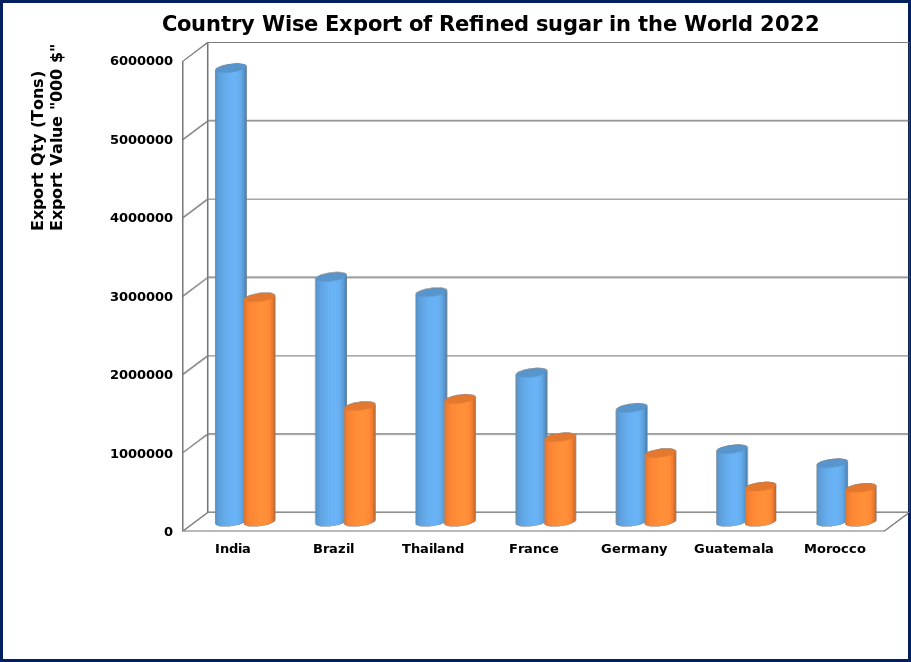
Sheet 10: Refined sugar
|
Country Wise Export of
Refined sugar in the World Year 2022 |
|
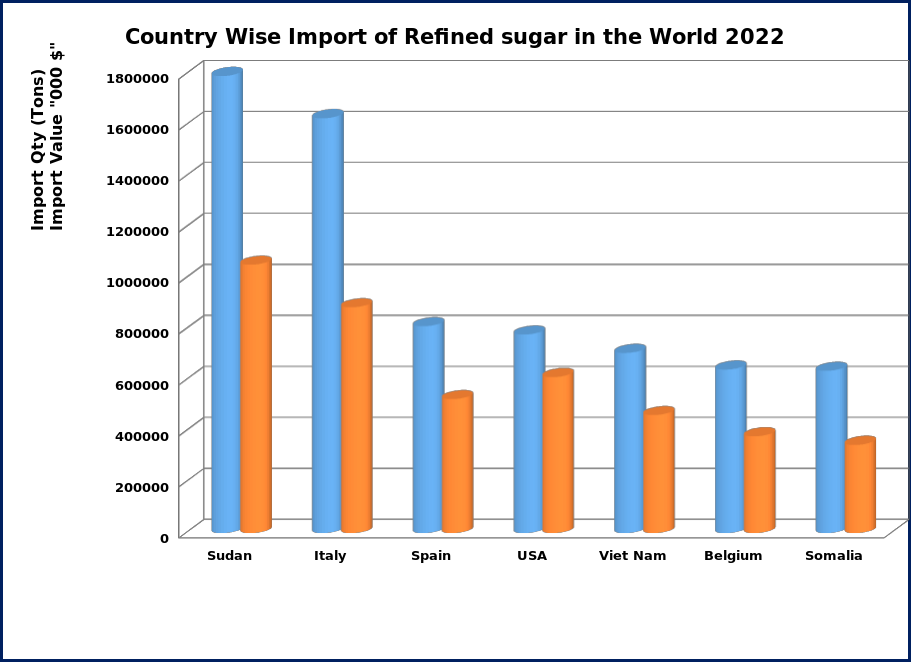
Country Wise Import of
Refined sugar in the World Year 2022 |
||||||
|
Sr. No. |
Countries |
Export Qty. in Tons |
Export Value in 000 $ |
|
Sr. No. |
Countries |
Import Qty. in Tons |
Import Value in 000 $ |
|
1 |
India |
5793079 |
2864654 |
|
1 |
Sudan |
1793610 |
1053263 |
|
2 |
Brazil |
3126431 |
1475648 |
|
2 |
Italy |
1627998 |
886121 |
|
3 |
Thailand |
2928847 |
1566876 |
|
3 |
Spain |
811748 |
525962 |
|
4 |
France |
1901674 |
1079384 |
|
4 |
USA |
779123 |
612514 |
|
5 |
Germany |
1453856 |
876326 |
|
5 |
Viet Nam |
706946 |
463389 |
|
6 |
Guatemala |
927252 |
449805 |
|
6 |
Belgium |
641871 |
380158 |
|
7 |
Morocco |
748188 |
431596 |
|
7 |
Somalia |
636928 |
346466 |
|
8 |
UAE |
701037 |
412180 |
|
8 |
China |
1117077 |
473663 |
|
9 |
Netherlands |
559911 |
370632 |
|
9 |
Türkiye |
632635 |
445512 |
|
10 |
Poland |
548176 |
314434 |
|
10 |
Djibouti |
480957 |
121869 |
|
11 |
Colombia |
466040 |
273302 |
|
11 |
Mauritania |
451844 |
297492 |
|
12 |
Belgium |
439179 |
301412 |
|
12 |
Chile |
450575 |
260543 |
|
13 |
Indonesia |
404477 |
250666 |
|
13 |
Sri Lanka |
446713 |
252277 |
|
14 |
Saudi Arabia |
398716 |
242218 |
|
14 |
Lao People's |
423326 |
255304 |
|
15 |
Djibouti |
380000 |
150000 |
|
15 |
Germany |
423326 |
260171 |
|
Total of Top 15 Countries |
20776865 |
11059133 |
|
Total of Top 15 Countries |
11424677 |
6634704 |
||
|
Total of 107 Other Countries |
5619166 |
3630674 |
|
136 |
Pakistan |
7676 |
5840 |
|
|
World Total |
26396030 |
14689807 |
|
Total of 164 Other Countries |
13563881 |
8664675 |
||
|
Source: FAO |
|
|
|
|
World Total |
24988558 |
15299379 |
|
|
|
|
|
|
|
Source: FAO |
|
|
|
Sheet 11: Export of Refined sugar
|
|
|
![]()
Sheet 12: Import of Refined sugar
|
|
|
![]()
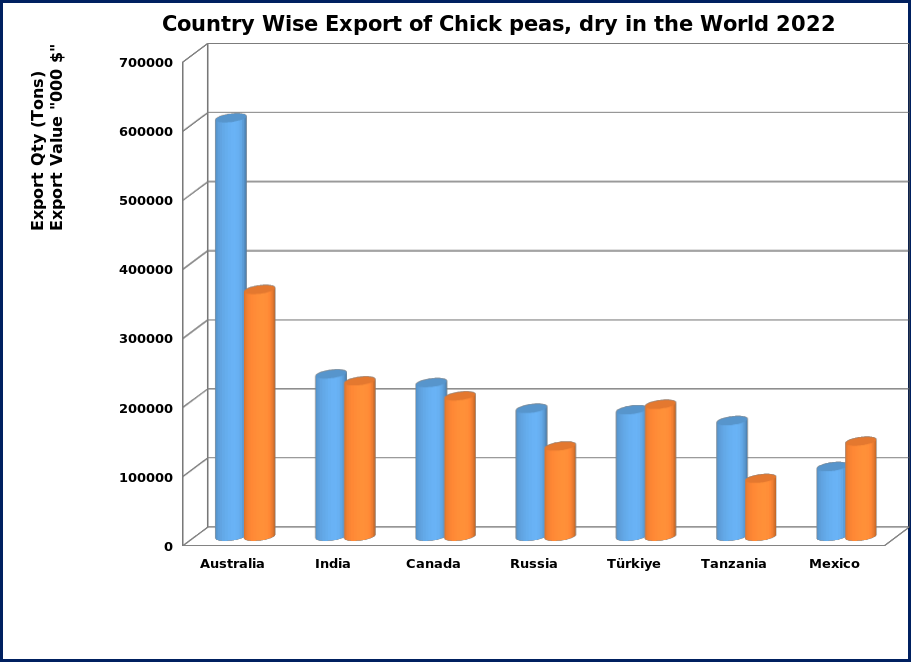
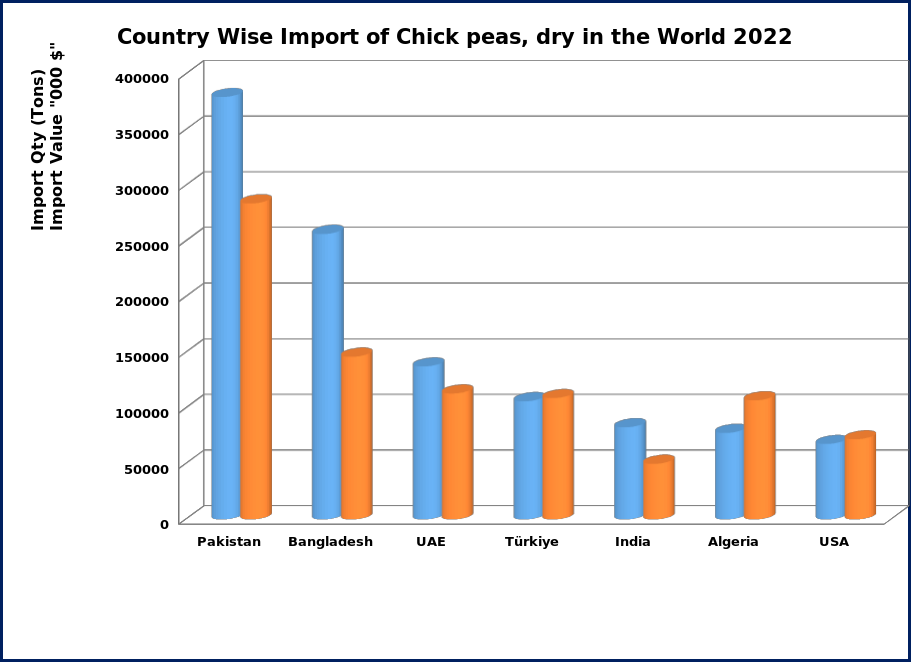
Sheet 13: Chick peas, dry
|
Country Wise Export of Gram (Chick
peas, dry) in the World Year 2022 |
|
Country Wise Import of Gram (Chick
peas, dry) in the World Year 2022 |
||||||
|
Sr. No. |
Countries |
Export Qty. in Tons |
Export Value in 000 $ |
|
Sr. No. |
Countries |
Import Qty. in Tons |
Import Value in 000 $ |
|
1 |
Australia |
605933 |
357368 |
|
1 |
Pakistan |
379547 |
284012 |
|
2 |
India |
235084 |
225000 |
|
2 |
Bangladesh |
256557 |
146250 |
|
3 |
Canada |
222479 |
203300 |
|
3 |
UAE |
137474 |
113183 |
|
4 |
Russia |
185232 |
130713 |
|
4 |
Türkiye |
106247 |
109082 |
|
5 |
Türkiye |
183189 |
191128 |
|
5 |
India |
82846 |
50020 |
|
6 |
Tanzania |
167547 |
83893 |
|
6 |
Algeria |
77800 |
107089 |
|
7 |
Mexico |
100952 |
137809 |
|
7 |
USA |
67834 |
71998 |
|
8 |
UAE |
95095 |
89429 |
|
8 |
Iran |
60303 |
56402 |
|
9 |
USA |
66720 |
66534 |
|
9 |
Nepal |
46632 |
30192 |
|
10 |
Argentina |
64141 |
45561 |
|
10 |
Iraq |
46031 |
62068 |
|
11 |
Sudan |
22679 |
11978 |
|
11 |
Syria |
44235 |
48367 |
|
12 |
France |
22458 |
19537 |
|
12 |
UK |
43103 |
45118 |
|
13 |
Myanmar |
19238 |
13384 |
|
13 |
Italy |
42101 |
46546 |
|
14 |
Ethiopia |
13445 |
12469 |
|
14 |
Saudi Arabia |
41272 |
44532 |
|
15 |
Kyrgyzstan |
10787 |
11701 |
|
15 |
Canada |
37778 |
37522 |
|
Total of Top 15 Countries |
2014980 |
1599804 |
|
Total of Top 15 Countries |
1469759 |
1252381 |
||
|
Total of 64 Other Countries |
82438 |
87620 |
|
Total of 145 Other Countries |
411510 |
443036 |
||
|
World Total |
2097418 |
1687424 |
|
World Total |
1881269 |
1695417 |
||
|
Source: FAO |
|
|
|
|
Source: FAO |
|
|
|
Sheet 14: Export of Chick peas, dry
|
|
|
![]()
Sheet 15: Import of Chick peas, dry
|
|
|
![]()
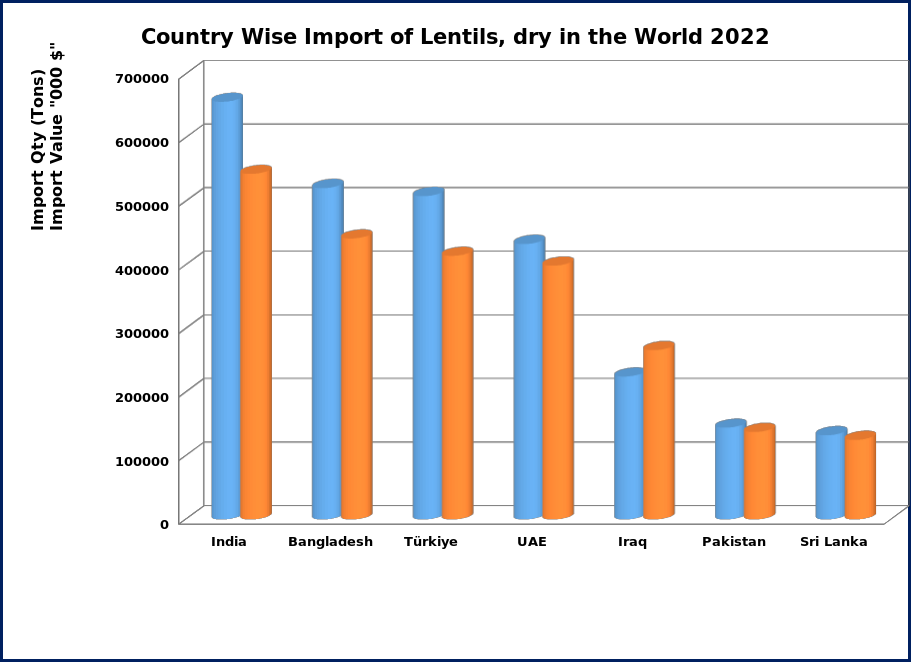
Sheet 16: Lentils, dry
|
Country Wise Export of Masoor (Lentils,
dry) in the World Year 2022 |
|
Country Wise Import of Masoor (Lentils,
dry) in the World Year 2022 |
||||||
|
Sr. No. |
Countries |
Export Qty. in Tons |
Export Value in 000 $ |
|
Sr. No. |
Countries |
Import Qty. in Tons |
Import Value in 000 $ |
|
1 |
Canada |
1892283 |
1638941 |
|
1 |
India |
656756 |
543421 |
|
2 |
Australia |
1045356 |
751960 |
|
2 |
Bangladesh |
521194 |
441872 |
|
3 |
Türkiye |
499192 |
537106 |
|
3 |
Türkiye |
508591 |
414639 |
|
4 |
UAE |
354953 |
389611 |
|
4 |
UAE |
433331 |
399219 |
|
5 |
USA |
173549 |
161983 |
|
5 |
Iraq |
224832 |
266330 |
|
6 |
Kazakhstan |
89699 |
58109 |
|
6 |
Pakistan |
144364 |
137673 |
|
7 |
Russia |
68056 |
53685 |
|
7 |
Sri Lanka |
132573 |
125253 |
|
8 |
India |
64891 |
68845 |
|
8 |
Ethiopia |
111748 |
78273 |
|
9 |
Belgium |
17313 |
22420 |
|
9 |
Sudan |
105968 |
122972 |
|
10 |
Myanmar |
14393 |
10299 |
|
10 |
Djibouti |
86547 |
102280 |
|
11 |
Argentina |
11825 |
9065 |
|
11 |
USA |
85688 |
87797 |
|
12 |
Netherlands |
10621 |
17916 |
|
12 |
Algeria |
83436 |
105948 |
|
13 |
Egypt |
9722 |
10263 |
|
13 |
Iran |
80097 |
113286 |
|
14 |
Germany |
5371 |
9795 |
|
14 |
Venezuela |
80000 |
105000 |
|
15 |
China |
5064 |
6666 |
|
15 |
Colombia |
76996 |
82486 |
|
Total of Top 15 Countries |
4262291 |
3746664 |
|
Total of Top 15 Countries |
3332122 |
3126449 |
||
|
Total of 66 Other Countries |
50581 |
67107 |
|
Total of 157 Other Countries |
936724 |
1117520 |
||
|
World Total |
4312872 |
3813771 |
|
World Total |
4268846 |
4243969 |
||
|
Source: FAO |
|
|
|
|
Source: FAO |
|
|
|
Sheet 17: Export of Lentils, dry
|
|
|
![]()
Sheet 18: Import of Lentils, dry
|
|
|
![]()
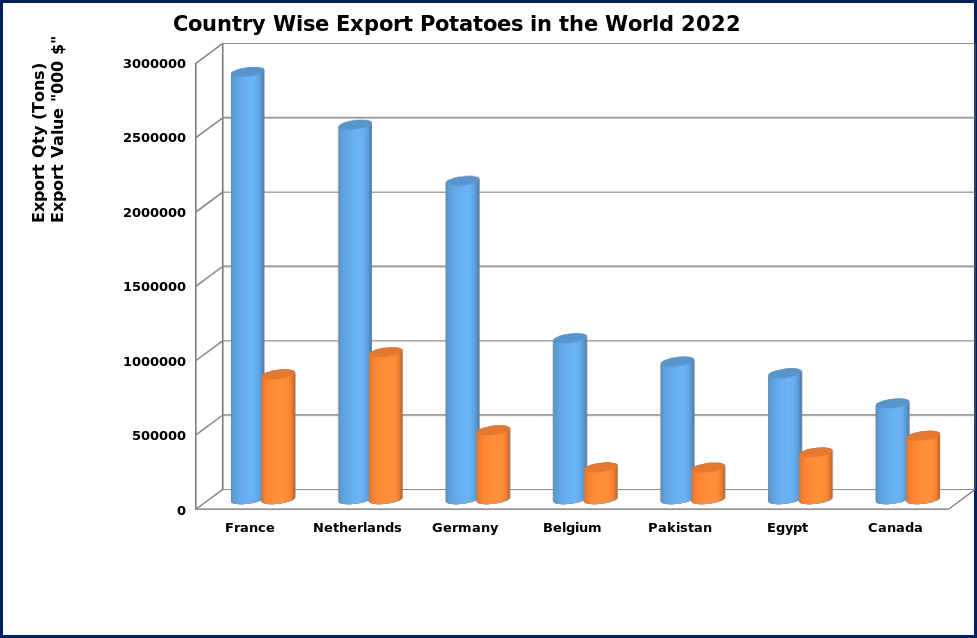
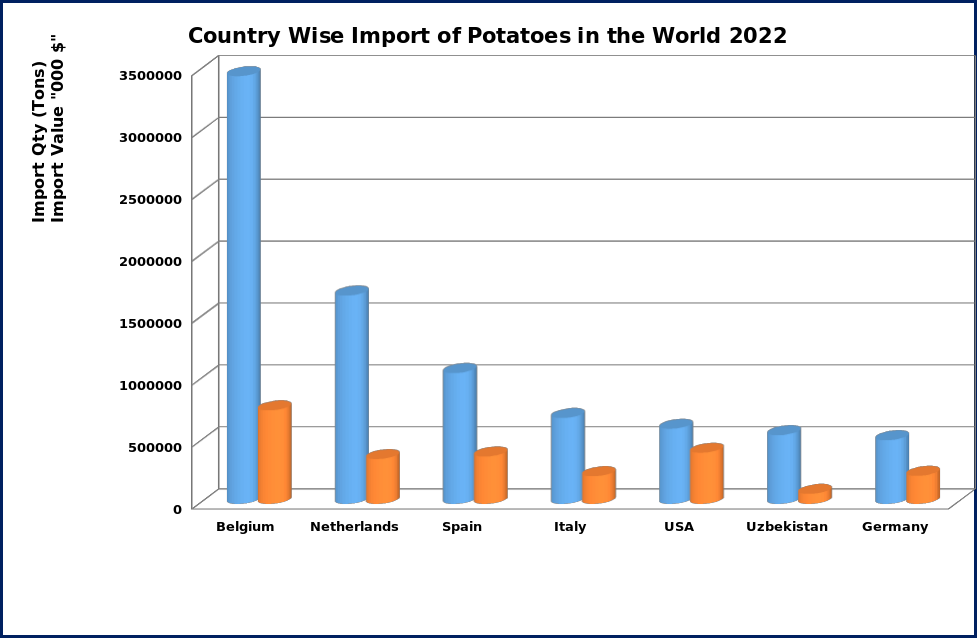
Sheet 19: Potatoes
|
Country Wise Export of
Potatoes in the World Year 2022 |
|
Country Wise Import of
Potatoes in the World Year 2022 |
||||||
|
Sr. No. |
Countries |
Export Qty. in Tons |
Export Value in 000 $ |
|
Sr. No. |
Countries |
Import Qty. in Tons |
Import Value in 000 $ |
|
1 |
France |
2875908 |
840593 |
|
1 |
Belgium |
3454517 |
755470 |
|
2 |
Netherlands |
2519573 |
989400 |
|
2 |
Netherlands |
1682846 |
362340 |
|
3 |
Germany |
2142387 |
464324 |
|
3 |
Spain |
1056788 |
383178 |
|
4 |
Belgium |
1083289 |
214692 |
|
4 |
Italy |
693526 |
223785 |
|
5 |
Pakistan |
925638 |
213765 |
|
5 |
USA |
606723 |
413270 |
|
6 |
Egypt |
847180 |
316001 |
|
6 |
Uzbekistan |
555346 |
81046 |
|
7 |
Canada |
645108 |
427470 |
|
7 |
Germany |
514373 |
227072 |
|
8 |
USA |
549920 |
303411 |
|
8 |
Russia |
479451 |
217993 |
|
9 |
China |
451825 |
248754 |
|
9 |
Portugal |
465417 |
131519 |
|
10 |
India |
441906 |
95582 |
|
10 |
France |
416054 |
137606 |
|
11 |
Spain |
369647 |
147329 |
|
11 |
Nepal |
302777 |
60789 |
|
12 |
Belarus |
298391 |
90197 |
|
12 |
UAE |
288738 |
80755 |
|
13 |
UK |
288845 |
171093 |
|
13 |
Afghanistan |
248852 |
54436 |
|
14 |
Kazakhstan |
242322 |
21475 |
|
14 |
Malaysia |
232568 |
100018 |
|
15 |
South Africa |
185213 |
48105 |
|
15 |
Egypt |
211366 |
146236 |
|
Total of Top 15 Countries |
13867152 |
4592191 |
|
Total of Top 15 Countries |
11209343 |
3375513 |
||
|
Total of 83 Other Countries |
1957971 |
677332 |
|
92 |
Pakistan |
11658 |
12646 |
|
|
World Total |
15825123 |
5269523 |
|
Total of 155 Other Countries |
5269375 |
2367965 |
||
|
Source: FAO |
|
|
|
|
World Total |
16478718 |
5743478 |
|
|
|
|
|
|
|
Source: FAO |
|
|
|
Sheet 20: Export of Potatoes
|
|
|
![]()
Sheet 21: Import of Potatoes
|
|
|
![]()
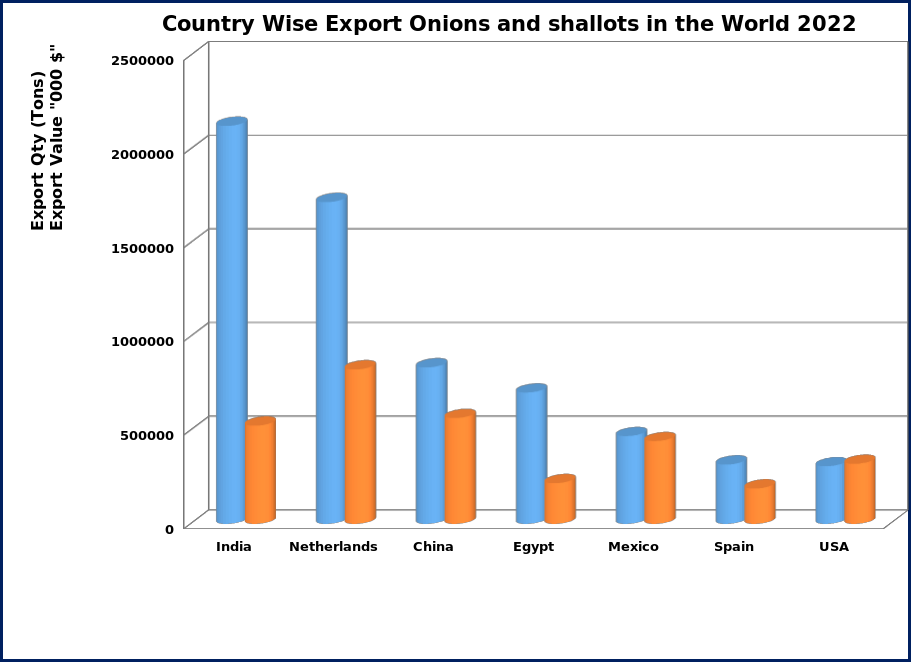
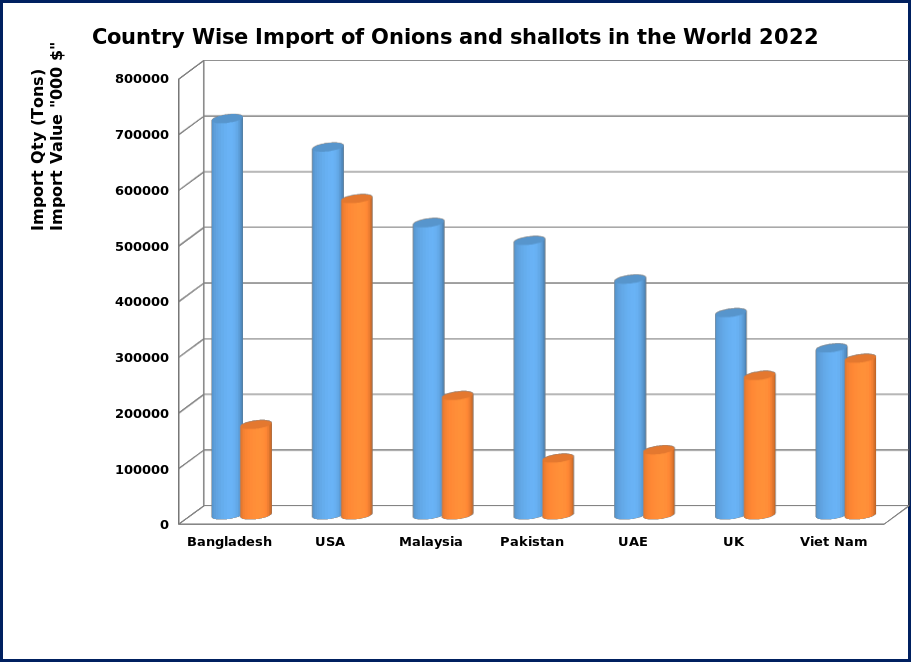
Sheet 22: Onions and shallots
|
Country Wise Export of
Onions and shallots in the World Year 2022 |
|
Country Wise Import of
Onions and shallots in the World Year 2022 |
||||||
|
Sr. No. |
Countries |
Export Qty. in Tons |
Export Value in 000 $ |
|
Sr. No. |
Countries |
Import Qty. in Tons |
Import Value in 000 $ |
|
1 |
India |
2124582 |
524591 |
|
1 |
Bangladesh |
712226 |
162593 |
|
2 |
Netherlands |
1717697 |
825049 |
|
2 |
USA |
660977 |
568474 |
|
3 |
China |
835088 |
564863 |
|
3 |
Malaysia |
525055 |
214545 |
|
4 |
Egypt |
701178 |
217474 |
|
4 |
Pakistan |
493137 |
102216 |
|
5 |
Mexico |
468476 |
441792 |
|
5 |
UAE |
423613 |
116984 |
|
6 |
Spain |
317220 |
188959 |
|
6 |
UK |
363491 |
250669 |
|
7 |
USA |
307347 |
320979 |
|
7 |
Viet Nam |
300051 |
281496 |
|
8 |
Peru |
295877 |
104580 |
|
8 |
Japan |
280478 |
186814 |
|
9 |
Afghanistan |
271868 |
44209 |
|
9 |
Sri Lanka |
278219 |
81340 |
|
10 |
Poland |
200831 |
114533 |
|
10 |
Poland |
240340 |
61914 |
|
11 |
Uzbekistan |
199646 |
35955 |
|
11 |
Saudi Arabia |
239978 |
80548 |
|
12 |
Türkiye |
183684 |
28436 |
|
12 |
Canada |
225547 |
243674 |
|
13 |
Kazakhstan |
178573 |
15458 |
|
13 |
Netherlands |
223227 |
138268 |
|
14 |
Iran |
162828 |
21070 |
|
14 |
Germany |
212699 |
163991 |
|
15 |
Argentina |
143172 |
25187 |
|
15 |
Russia |
198338 |
65043 |
|
Total of Top 15 Countries |
8108067 |
3473135 |
|
Total of Top 15 Countries |
5377377 |
2718569 |
||
|
16 |
Pakistan |
132476 |
44769 |
|
Total of 138 Other Countries |
3553829 |
1486320 |
|
|
Total of 87 Other Countries |
1447192 |
643487 |
|
World Total |
8931206 |
4204889 |
||
|
World Total |
9555259 |
4116622 |
|
Source: FAO |
|
|
|
|
|
Source: FAO |
|
|
|
|
|
|
|
|
Sheet 23: Export of Onions and shallots
|
|
|
![]()
Sheet 24: Import of Onions and shallots
|
|
|
![]()
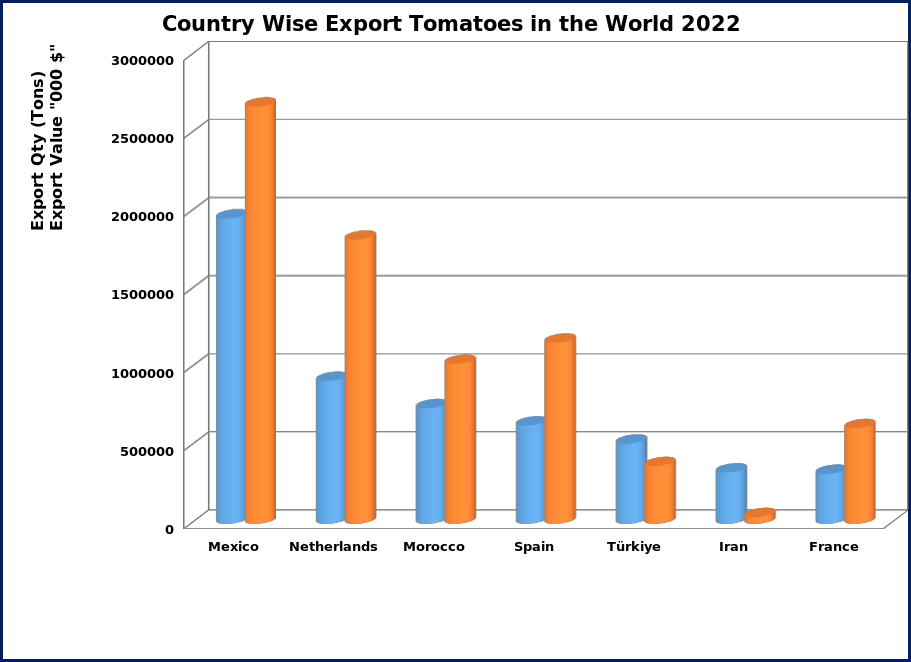
Sheet 25: Tomatoes
|
Country Wise Export of
Tomatoes in the World Year 2022 |
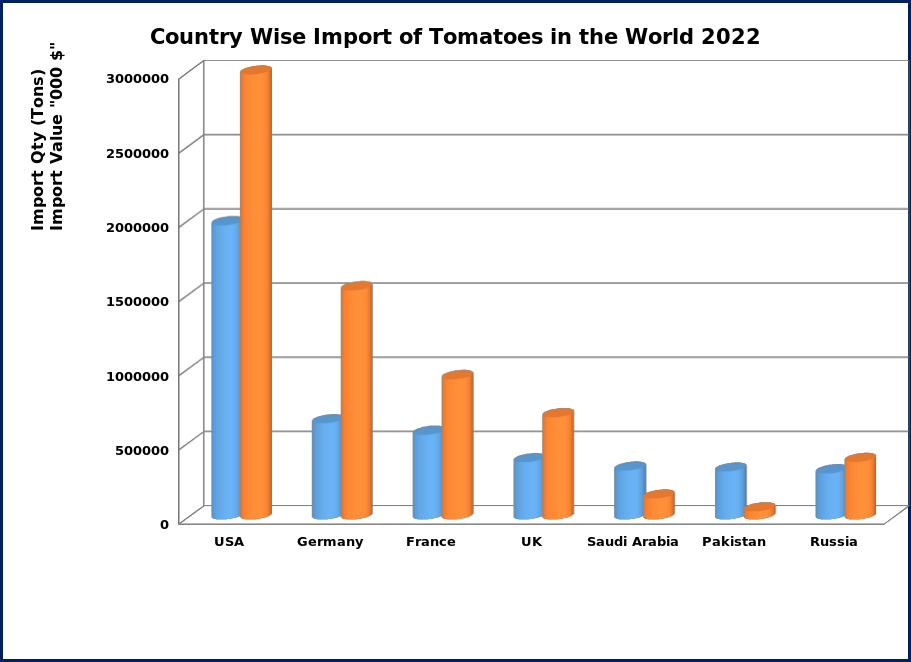
|
Country Wise Import of
Tomatoes in the World Year 2022 |
||||||
|
Sr. No. |
Countries |
Export Qty. in Tons |
Export Value in 000 $ |
|
Sr. No. |
Countries |
Import Qty. in Tons |
Import Value in 000 $ |
|
1 |
Mexico |
1956214 |
2673046 |
|
1 |
USA |
1982138 |
2998594 |
|
2 |
Netherlands |
915019 |
1819695 |
|
2 |
Germany |
647793 |
1543830 |
|
3 |
Morocco |
740661 |
1024593 |
|
3 |
France |
569877 |
944890 |
|
4 |
Spain |
630424 |
1160267 |
|
4 |
UK |
385340 |
688752 |
|
5 |
Türkiye |
513606 |
370682 |
|
5 |
Saudi Arabia |
329366 |
141031 |
|
6 |
Iran |
329848 |
43829 |
|
6 |
Pakistan |
322697 |
54559 |
|
7 |
France |
320230 |
612200 |
|
7 |
Russia |
310540 |
387140 |
|
8 |
China |
249123 |
327543 |
|
8 |
Netherlands |
266041 |
427784 |
|
9 |
Afghanistan |
210486 |
31980 |
|
9 |
Iraq |
254564 |
115052 |
|
10 |
Belgium |
207807 |
318655 |
|
10 |
UAE |
221389 |
52226 |
|
11 |
USA |
191464 |
312387 |
|
11 |
Canada |
197905 |
327223 |
|
12 |
Canada |
190607 |
469289 |
|
12 |
Spain |
188099 |
216916 |
|
13 |
Portugal |
156231 |
80575 |
|
13 |
Poland |
180796 |
327783 |
|
14 |
Azerbaijan |
141420 |
167609 |
|
14 |
Italy |
152855 |
215178 |
|
15 |
Jordan |
89936 |
52033 |
|
15 |
El Salvador |
111125 |
16525 |
|
Total of Top 15 Countries |
6843075 |
9464383 |
|
Total of Top 15 Countries |
6120523 |
8457483 |
||
|
51 |
Pakistan |
5689 |
1111 |
|
Total of 127 Other Countries |
1791567 |
2071660 |
|
|
Total of 89 Other Countries |
1122949 |
1049036 |
|
World Total |
7912090 |
10529143 |
||
|
World Total |
7966024 |
10513419 |
|
Source: FAO |
|
|
|
|
|
Source: FAO |
|
|
|
|
|
|
|
|
Sheet 26: Export of Tomatoes
|
|
|
![]()
Sheet 27: Import of Tomatoes
|
|
|
![]()
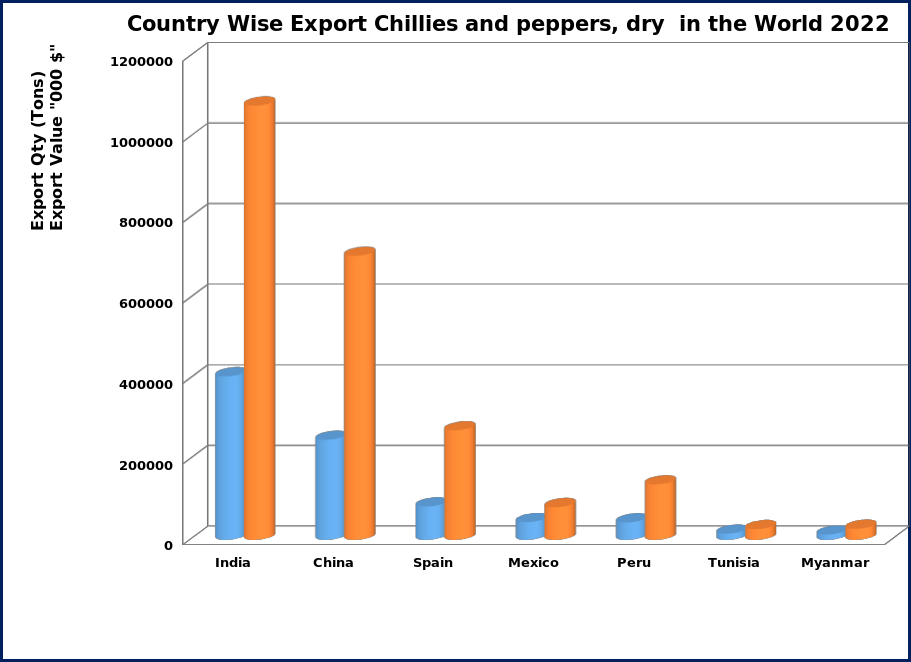
Sheet 28: Chillies and peppers, dry
|
Country Wise Export of Chillies and
peppers, dry in the World Year 2022 |
|
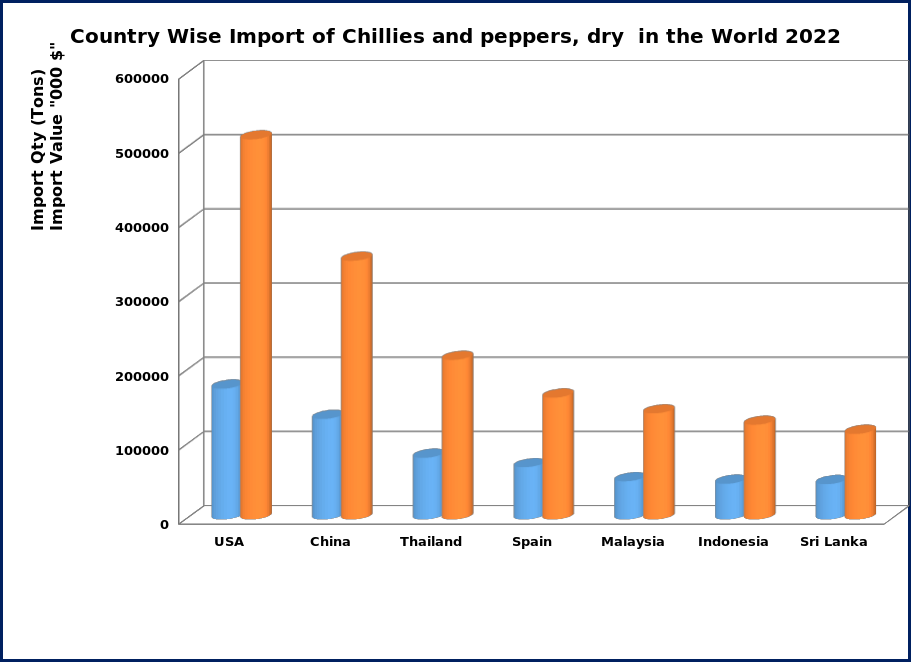
Country Wise Import of Chillies and
peppers, dry in the World Year 2022 |
||||||
|
Sr. No. |
Countries |
Export Qty. in Tons |
Export Value in 000 $ |
|
Sr. No. |
Countries |
Import Qty. in Tons |
Import Value in 000 $ |
|
1 |
India |
406063 |
1078120 |
|
1 |
USA |
176351 |
512309 |
|
2 |
China |
248477 |
705154 |
|
2 |
China |
135485 |
348617 |
|
3 |
Spain |
82894 |
271798 |
|
3 |
Thailand |
83149 |
215091 |
|
4 |
Mexico |
44022 |
81519 |
|
4 |
Spain |
70341 |
164262 |
|
5 |
Peru |
43467 |
137784 |
|
5 |
Malaysia |
51458 |
143022 |
|
6 |
Tunisia |
15590 |
26758 |
|
6 |
Indonesia |
48166 |
127637 |
|
7 |
Myanmar |
13230 |
27604 |
|
7 |
Sri Lanka |
47704 |
115405 |
|
8 |
Uzbekistan |
11775 |
10563 |
|
8 |
Mexico |
44035 |
144724 |
|
9 |
Thailand |
9579 |
14315 |
|
9 |
Bangladesh |
33287 |
81536 |
|
10 |
Netherlands |
8274 |
32942 |
|
10 |
Germany |
25434 |
95652 |
|
11 |
USA |
7615 |
26193 |
|
11 |
UK |
15659 |
66714 |
|
12 |
Germany |
7476 |
46207 |
|
12 |
Netherlands |
15281 |
45450 |
|
13 |
Viet Nam |
6278 |
14067 |
|
13 |
Japan |
14666 |
72845 |
|
14 |
Zambia |
5593 |
12877 |
|
14 |
UAE |
14221 |
34935 |
|
15 |
Türkiye |
5047 |
14125 |
|
15 |
Canada |
10877 |
47533 |
|
Total of Top 15 Countries |
915379 |
2500026 |
|
Total of Top 15 Countries |
786114 |
2215732 |
||
|
21 |
Pakistan |
2385 |
6127 |
|
40 |
Pakistan |
2749 |
5343 |
|
Total of 97 Other Countries |
62476 |
227753 |
|
Total of 154 Other Countries |
224378 |
620650 |
||
|
World Total |
977855 |
2727779 |
|
World Total |
1010492 |
2836382 |
||
|
Source: FAO |
|
|
|
|
Source: FAO |
|
|
|
Sheet 29: Export of Chillies
|
|
|
![]()
Sheet 30: Import of Chillies
|
|
|
![]()
Sheet 31: Garlic
|
Country Wise Export of
Garlic in the World Year 2022 |
|
Country Wise Import of
Garlic in the World Year 2022 |
||||||
|
Sr. No. |
Countries |
Export Qty. in Tons |
Export Value in 000 $ |
|
Sr. No. |
Countries |
Import Qty. in Tons |
Import Value in 000 $ |
|
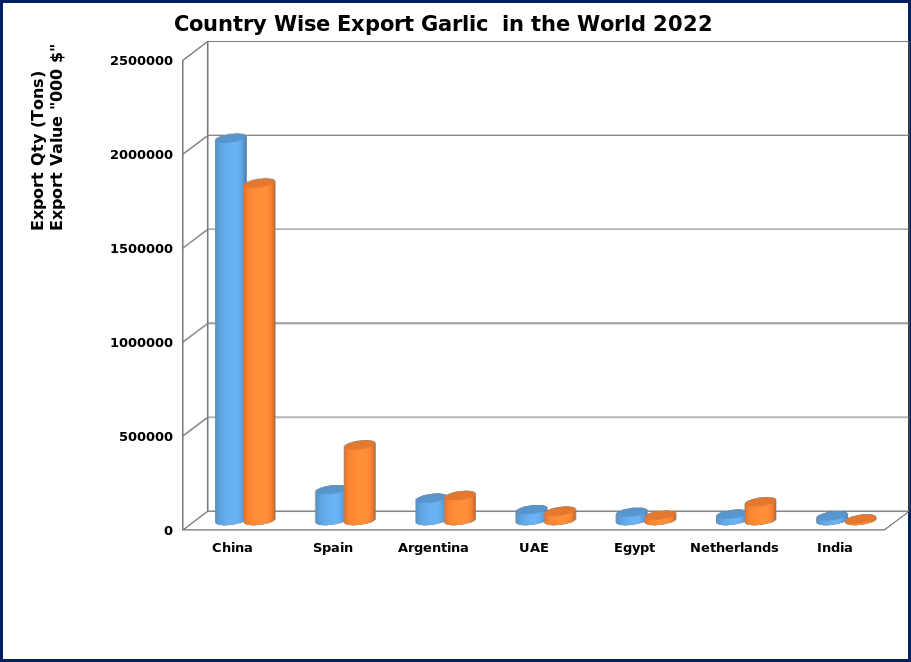
1 |
China |
2035905 |
1796197 |
|
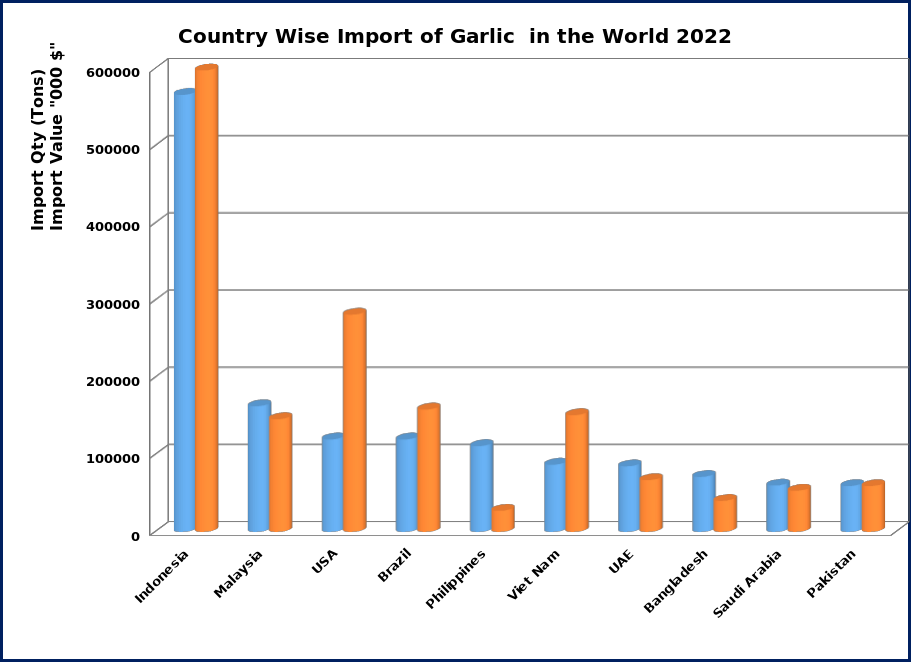
1 |
Indonesia |
566176 |
597795 |
|
2 |
Spain |
164802 |
402489 |
|
2 |
Malaysia |
162690 |
146011 |
|
3 |
Argentina |
119178 |
133306 |
|
3 |
USA |
119759 |
281398 |
|
4 |
UAE |
58679 |
50477 |
|
4 |
Brazil |
119665 |
158461 |
|
5 |
Egypt |
44494 |
29620 |
|
5 |
Philippines |
111067 |
27259 |
|
6 |
Netherlands |
34752 |
100116 |
|
6 |
Viet Nam |
86931 |
151150 |
|
7 |
India |
25409 |
8794 |
|
7 |
UAE |
84871 |
67014 |
|
8 |
Mexico |
24052 |
40102 |
|
8 |
Bangladesh |
71152 |
40126 |
|
9 |
Malaysia |
23702 |
11814 |
|
9 |
Saudi Arabia |
59960 |
53190 |
|
10 |
Peru |
16310 |
23226 |
|
10 |
Pakistan |
59331 |
59230 |
|
11 |
Chile |
13266 |
26362 |
|
11 |
Russia |
52270 |
66273 |
|
12 |
France |
9819 |
37228 |
|
12 |
Netherlands |
39568 |
85860 |
|
13 |
Italy |
7242 |
29021 |
|
13 |
Thailand |
36421 |
18276 |
|
14 |
Slovenia |
5765 |
9189 |
|
14 |
Colombia |
35614 |
35770 |
|
15 |
Türkiye |
5169 |
3326 |
|
15 |
Sri Lanka |
33741 |
29490 |
|
Total of Top 15 Countries |
2588542 |
2701267 |
|
Total of Top 15 Countries |
1639217 |
1817303 |
||
|
55 |
Pakistan |
186 |
205 |
|
Total of 157 Other Countries |
708739 |
1158171 |
|
|
Total of 75 Other Countries |
41134 |
71041 |
|
World Total |
2347956 |
2975474 |
||
|
World Total |
2629676 |
2772308 |
|
Source: FAO |
|
|
|
|
|
Source: FAO |
|
|
|
|
|
|
|
|
Sheet 32: Export of Garlic
|
|
|
![]()
Sheet 33: Import of Garlic
|
|
|
![]()
Sheet 34: Ginger
|
Country Wise Export of
Ginger in the World Year 2022 |
|
Country Wise Import of
Ginger in the World Year 2022 |
||||||
|
Sr. No. |
Countries |
Export Qty. in Tons |
Export Value in 000 $ |
|
Sr. No. |
Countries |
Import Qty. in Tons |
Import Value in 000 $ |
|
1 |
China |
417072 |
349781 |
|
1 |
USA |
107909 |
157974 |
|
2 |
Thailand |
98806 |
56568 |
|
2 |
Bangladesh |
97977 |
41205 |
|
3 |
India |
79117 |
67482 |
|
3 |
Netherlands |
87762 |
127212 |
|
4 |
Netherlands |
64343 |
122435 |
|
4 |
Pakistan |
79587 |
60876 |
|
5 |
Peru |
55436 |
64878 |
|
5 |
UAE |
67637 |
38430 |
|
6 |
UAE |
48516 |
47074 |
|
6 |
Japan |
62114 |
111721 |
|
7 |
Brazil |
34440 |
33001 |
|
7 |
Malaysia |
57156 |
32864 |
|
8 |
Nigeria |
26646 |
51217 |
|
8 |
Germany |
37758 |
92744 |
|
9 |
Nepal |
20612 |
7360 |
|
9 |
Saudi Arabia |
35284 |
24966 |
|
10 |
Germany |
8475 |
26910 |
|
10 |
UK |
29576 |
49342 |
|
11 |
Côte d'Ivoire |
7072 |
983 |
|
11 |
India |
27645 |
21361 |
|
12 |
Indonesia |
6448 |
5449 |
|
12 |
Canada |
21251 |
36162 |
|
13 |
Myanmar |
4883 |
4761 |
|
13 |
Yemen |
18817 |
18603 |
|
14 |
Spain |
4802 |
12417 |
|
14 |
Thailand |
17093 |
17530 |
|
15 |
USA |
4385 |
8988 |
|
15 |
Viet Nam |
12821 |
13779 |
|
Total of Top 15 Countries |
881052 |
859304 |
|
Total of Top 15 Countries |
760390 |
844769 |
||
|
Total of 88 Other Countries |
33678 |
65905 |
|
Total of 161 Other Countries |
198639 |
304070 |
||
|
World Total |
914729 |
925209 |
|
World Total |
959029 |
1148839 |
||
|
Source: FAO |
|
|
|
|
Source: FAO |
|
|
|
Sheet 35: Export of Ginger
|
|
|
![]()
Sheet 36: Import of Ginger
|
|
|
![]()
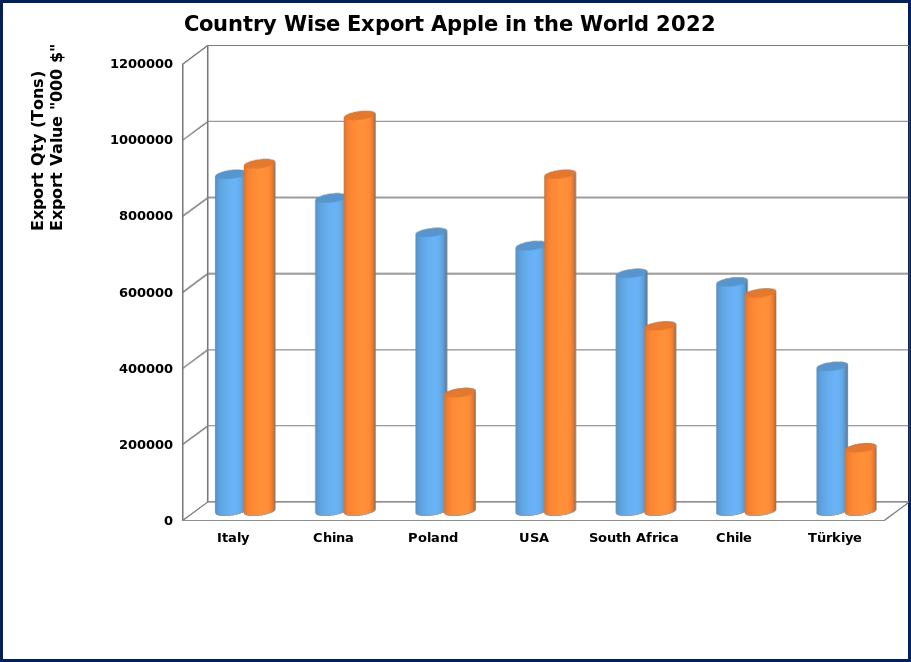
Sheet 37: Apple
|
Country Wise Export of
Apple in the World Year 2022 |
|
Country Wise Import of
Apple in the World Year 2022 |
||||||
|
Sr. No. |
Countries |
Export Qty. in Tons |
Export Value in 000 $ |
|
Sr. No. |
Countries |
Import Qty. in Tons |
Import Value in 000 $ |
|
1 |
Italy |
885329 |
913162 |
|
1 |
Germany |
537846 |
485744 |
|
2 |
China |
823127 |
1040204 |
|
2 |
Russia |
489855 |
354287 |
|
3 |
Poland |
732730 |
311498 |
|
3 |
Iraq |
395367 |
877008 |
|
4 |
USA |
697836 |
885731 |
|
4 |
India |
392483 |
314345 |
|
5 |
South Africa |
625044 |
486944 |
|
5 |
UK |
322163 |
391870 |
|
6 |
Chile |
602535 |
573257 |
|
6 |
Mexico |
295183 |
377680 |
|
7 |
Türkiye |
380492 |
166488 |
|
7 |
Netherlands |
224711 |
275064 |
|
8 |
France |
342490 |
402140 |
|
8 |
Spain |
222569 |
167697 |
|
9 |
New Zealand |
340762 |
563824 |
|
9 |
UAE |
215482 |
167207 |
|
10 |
Moldova |
188644 |
90704 |
|
10 |
Viet Nam |
208614 |
248423 |
|
11 |
Iran |
184997 |
62832 |
|
11 |
Bangladesh |
208125 |
201462 |
|
12 |
Netherlands |
167712 |
198743 |
|
12 |
Canada |
203251 |
245825 |
|
13 |
Belgium |
163287 |
74836 |
|
13 |
Egypt |
182316 |
356709 |
|
14 |
Serbia |
148077 |
107675 |
|
14 |
Thailand |
182163 |
253384 |
|
15 |
Lebanon |
114424 |
43666 |
|
15 |
Indonesia |
175519 |
355509 |
|
Total of Top 15 Countries |
6397486 |
5921704 |
|
Total of Top 15 Countries |
4255648 |
5072214 |
||
|
80 |
Pakistan |
128 |
85 |
|
52 |
Pakistan |
28774 |
13170 |
|
Total of 84 Other Countries |
1336982 |
937974 |
|
Total of 161 Other Countries |
3599811 |
3531970 |
||
|
World Total |
7734468 |
6859678 |
|
World Total |
7855458 |
8604184 |
||
|
Source: FAO |
|
|
|
|
Source: FAO |
|
|
|
Sheet 38: Export of Apple
|
|
|
![]()
Sheet 39: Import of Apple
|
|
|

![]()
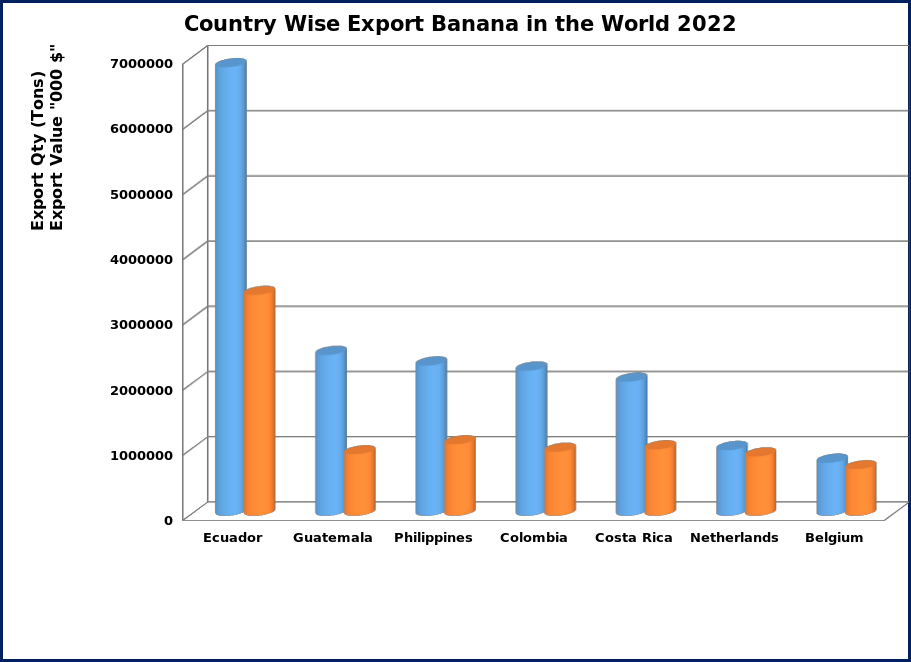
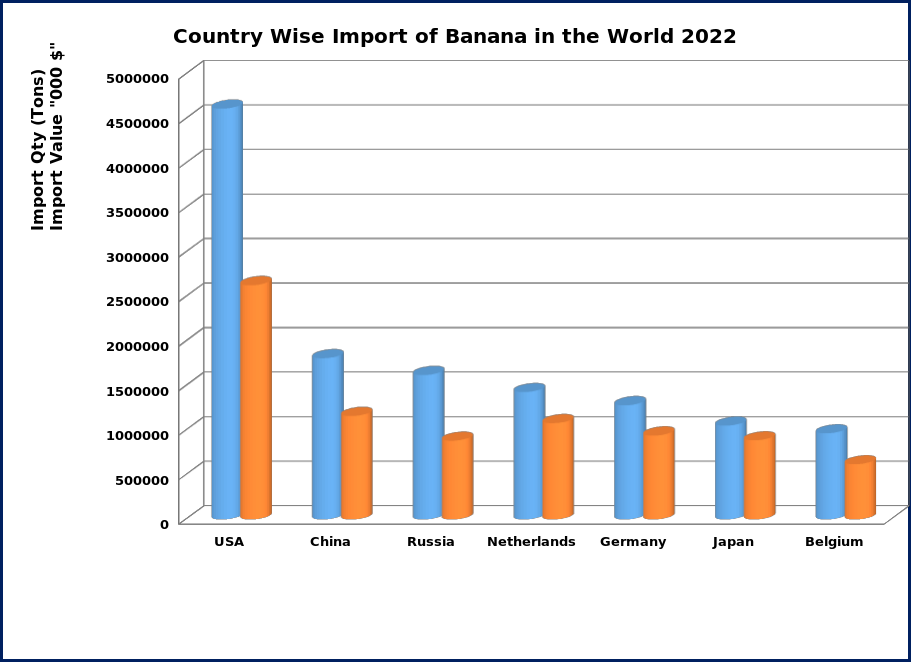
Sheet 40: Banana
|
Country Wise Export of
Banana in the World Year 2022 |
|
Country Wise Import of
Banana in the World Year 2022 |
||||||
|
Sr. No. |
Countries |
Export Qty. in Tons |
Export Value in 000 $ |
|
Sr. No. |
Countries |
Import Qty. in Tons |
Import Value in 000 $ |
|
1 |
Ecuador |
6879239 |
3386169 |
|
1 |
USA |
4614517 |
2631698 |
|
2 |
Guatemala |
2464291 |
942404 |
|
2 |
China |
1810696 |
1162720 |
|
3 |
Philippines |
2301596 |
1095512 |
|
3 |
Russia |
1622518 |
884824 |
|
4 |
Colombia |
2224395 |
979045 |
|
4 |
Netherlands |
1431196 |
1082003 |
|
5 |
Costa Rica |
2053751 |
1016573 |
|
5 |
Germany |
1283209 |
943304 |
|
6 |
Netherlands |
1005910 |
907443 |
|
6 |
Japan |
1053353 |
889577 |
|
7 |
Belgium |
812361 |
712417 |
|
7 |
Belgium |
967552 |
620556 |
|
8 |
USA |
580258 |
479472 |
|
8 |
UK |
852572 |
616925 |
|
9 |
Honduras |
556039 |
282877 |
|
9 |
France |
760352 |
673594 |
|
10 |
Viet Nam |
515229 |
262098 |
|
10 |
Italy |
758601 |
510088 |
|
11 |
Mexico |
481987 |
250455 |
|
11 |
Canada |
571568 |
463488 |
|
12 |
Côte d'Ivoire |
381239 |
167939 |
|
12 |
Argentina |
469912 |
315694 |
|
13 |
India |
362364 |
161808 |
|
13 |
Poland |
469185 |
340664 |
|
14 |
Dominican Republic |
349250 |
323814 |
|
14 |
Spain |
403756 |
273073 |
|
15 |
Cambodia |
342377 |
179988 |
|
15 |
Korea |
319852 |
283876 |
|
Total of Top 15 Countries |
21310285 |
11148014 |
|
Total of Top 15 Countries |
17388840 |
11692084 |
||
|
23 |
Pakistan |
129790 |
27036 |
|
125 |
Pakistan |
26 |
35 |
|
Total of 89 Other Countries |
3032760 |
1846062 |
|
Total of 110 Other Countries |
5186679 |
3408051 |
||
|
World Total |
24343046 |
12994076 |
|
World Total |
22575519 |
15100135 |
||
|
Source: FAO |
|
|
|
|
Source: FAO |
|
|
|
Sheet 41: Export of Banana
|
|
|
![]()
Sheet 42: Import of Banana
|
|
|
![]()
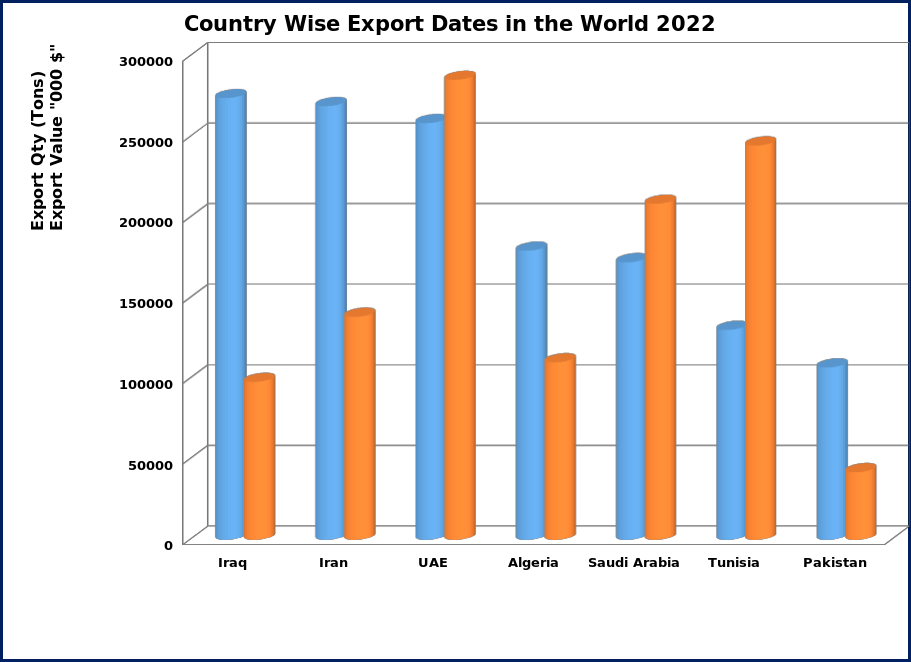
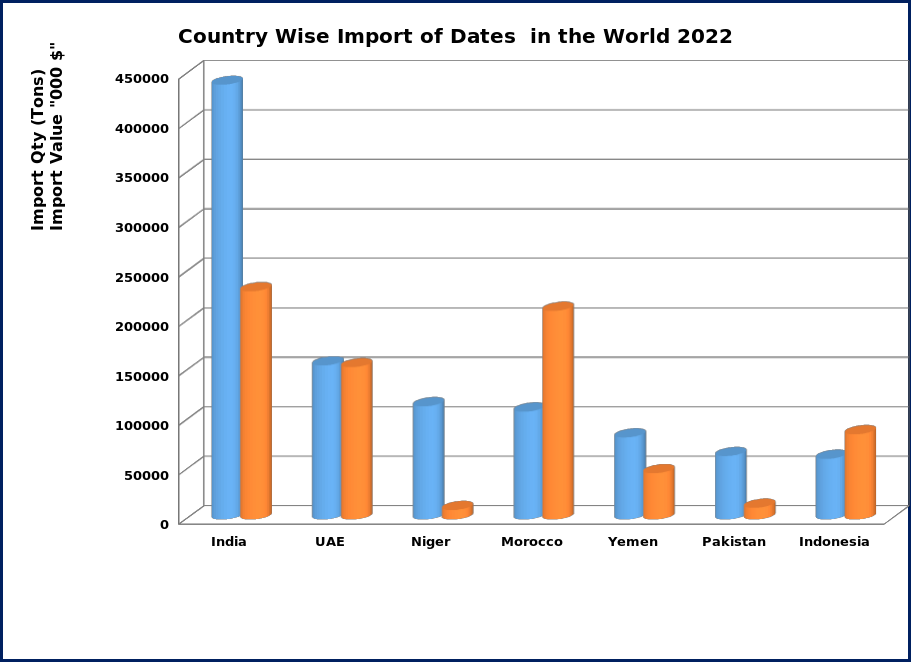
Sheet 43: Dates
|
Country Wise Export of
Dates in the World Year 2022 |
|
Country Wise Import of
Dates in the World Year 2022 |
||||||
|
Sr. No. |
Countries |
Export Qty. in Tons |
Export Value in 000 $ |
|
Sr. No. |
Countries |
Import Qty. in Tons |
Import Value in 000 $ |
|
1 |
Iraq |
274180 |
98071 |
|
1 |
India |
439477 |
230760 |
|
2 |
Iran |
269193 |
138451 |
|
2 |
UAE |
155775 |
153970 |
|
3 |
UAE |
258655 |
285506 |
|
3 |
Niger |
114479 |
9620 |
|
4 |
Algeria |
179429 |
110226 |
|
4 |
Morocco |
109092 |
210931 |
|
5 |
Saudi Arabia |
172268 |
208559 |
|
5 |
Yemen |
82975 |
46795 |
|
6 |
Tunisia |
130307 |
244751 |
|
6 |
Pakistan |
64136 |
11898 |
|
7 |
Pakistan |
106989 |
42054 |
|
7 |
Indonesia |
61353 |
86256 |
|
8 |
Mexico |
68987 |
219220 |
|
8 |
Türkiye |
52422 |
63302 |
|
9 |
Israel |
67042 |
330087 |
|
9 |
France |
44713 |
96064 |
|
10 |
Egypt |
54171 |
69511 |
|
10 |
Bangladesh |
37373 |
49929 |
|
11 |
USA |
15788 |
82346 |
|
11 |
Kazakhstan |
35070 |
14658 |
|
12 |
Türkiye |
14551 |
29964 |
|
12 |
Afghanistan |
32247 |
25207 |
|
13 |
Netherlands |
14341 |
67804 |
|
13 |
Germany |
26000 |
67801 |
|
14 |
France |
11899 |
32463 |
|
14 |
USA |
25252 |
86384 |
|
15 |
Oman |
9752 |
11477 |
|
15 |
Malaysia |
24440 |
60712 |
|
Total of Top 15 Countries |
1647552 |
1970490 |
|
Total of Top 15 Countries |
1304804 |
1214287 |
||
|
Total of 90 Other Countries |
68147 |
187678 |
|
Total of 164 Other Countries |
414191 |
781125 |
||
|
World Total |
1715699 |
2158168 |
|
World Total |
1718995 |
1995412 |
||
|
Source: FAO |
|
|
|
|
Source: FAO |
|
|
|
Sheet 44: Export of Dates
|
|
|
![]()
Sheet 45: Import of Dates
|
|
|
![]()
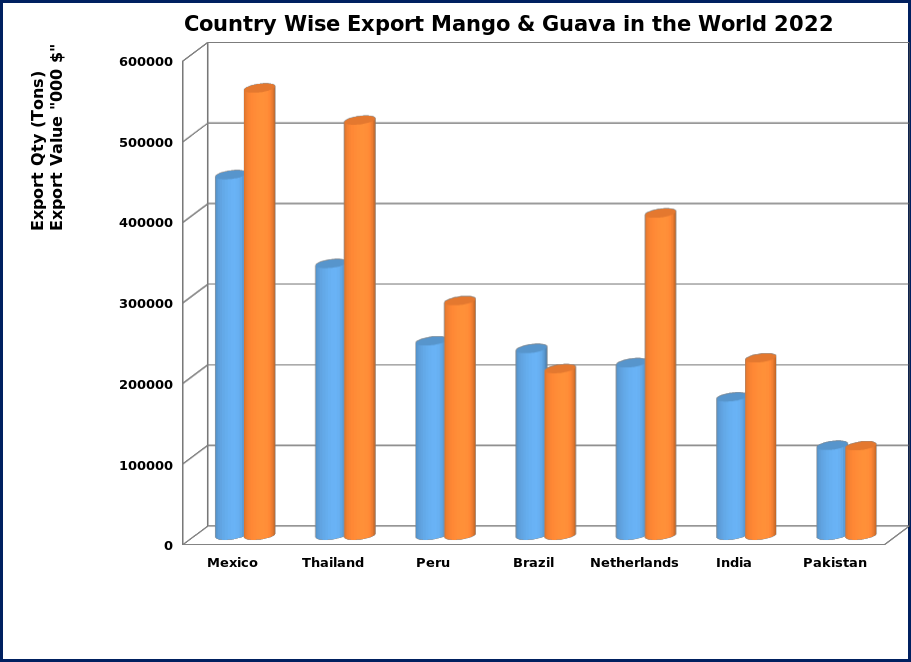
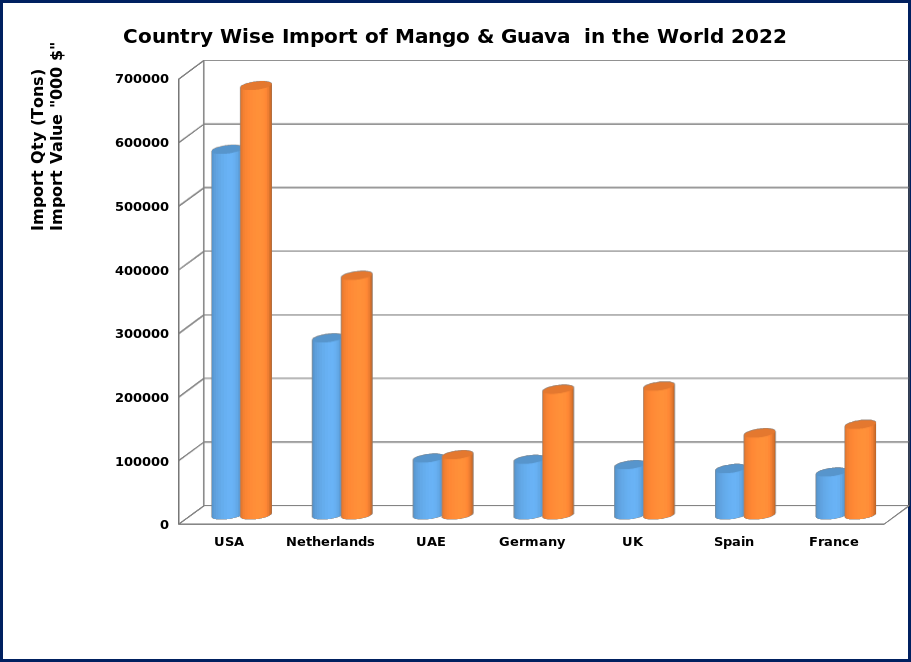
Sheet 46: Mango & Guava
|
Country Wise Export of
Mango & Guava in the World Year 2022 |
|
Country Wise Import of Mango & Guava
in the World Year 2022 |
||||||
|
Sr. No. |
Countries |
Export Qty. in Tons |
Export Value in 000 $ |
|
Sr. No. |
Countries |
Import Qty. in Tons |
Import Value in 000 $ |
|
1 |
Mexico |
447503 |
555109 |
|
1 |
USA |
574783 |
675235 |
|
2 |
Thailand |
337263 |
515278 |
|
2 |
Netherlands |
278253 |
376546 |
|
3 |
Peru |
241183 |
291172 |
|
3 |
UAE |
89456 |
94650 |
|
4 |
Brazil |
231874 |
206853 |
|
4 |
Germany |
87398 |
197617 |
|
5 |
Netherlands |
214064 |
399911 |
|
5 |
UK |
78928 |
202565 |
|
6 |
India |
171749 |
220198 |
|
6 |
Spain |
72890 |
128891 |
|
7 |
Pakistan |
111695 |
111124 |
|
7 |
France |
67453 |
142358 |
|
8 |
Ecuador |
64404 |
51408 |
|
8 |
Malaysia |
57920 |
21473 |
|
9 |
Spain |
62334 |
116385 |
|
9 |
Iran |
42944 |
31347 |
|
10 |
Ivory Coast |
55018 |
30062 |
|
10 |
Saudi Arabia |
38355 |
48300 |
|
11 |
Kenya |
24943 |
20854 |
|
11 |
Portugal |
37974 |
62468 |
|
12 |
Belgium |
22797 |
34618 |
|
12 |
Viet Nam |
37660 |
21862 |
|
13 |
UAE |
22517 |
29052 |
|
13 |
Belgium |
37380 |
58731 |
|
14 |
Cambodia |
20338 |
20965 |
|
14 |
Thailand |
35097 |
7411 |
|
15 |
Guatemala |
19086 |
9550 |
|
15 |
Singapore |
29317 |
27871 |
|
Total of Top 15 Countries |
2046768 |
2612539 |
|
Total of Top 15 Countries |
1565807 |
2097325 |
||
|
Total of 90 Other Countries |
193568 |
377466 |
|
Total of 113 Other Countries |
385898 |
665738 |
||
|
World Total |
2240336 |
2990005 |
|
World Total |
1951705 |
2763063 |
||
|
Source: FAO |
|
|
|
|
Source: FAO |
|
|
|
Sheet 47: Export of Mango & Guava
|
|
|
![]()
Sheet 48: Import of Mango & Guava
|
|
|
![]()
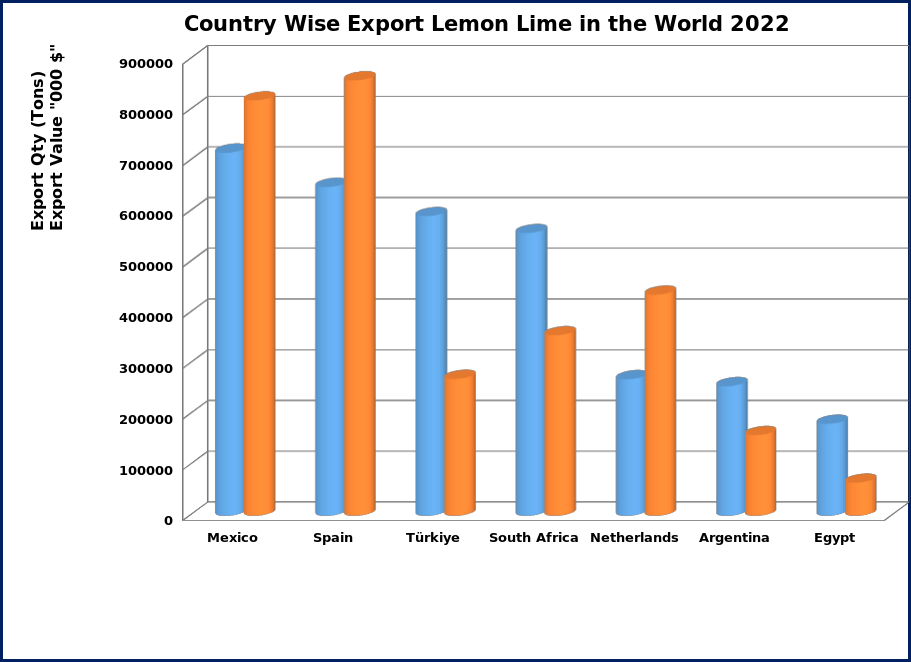
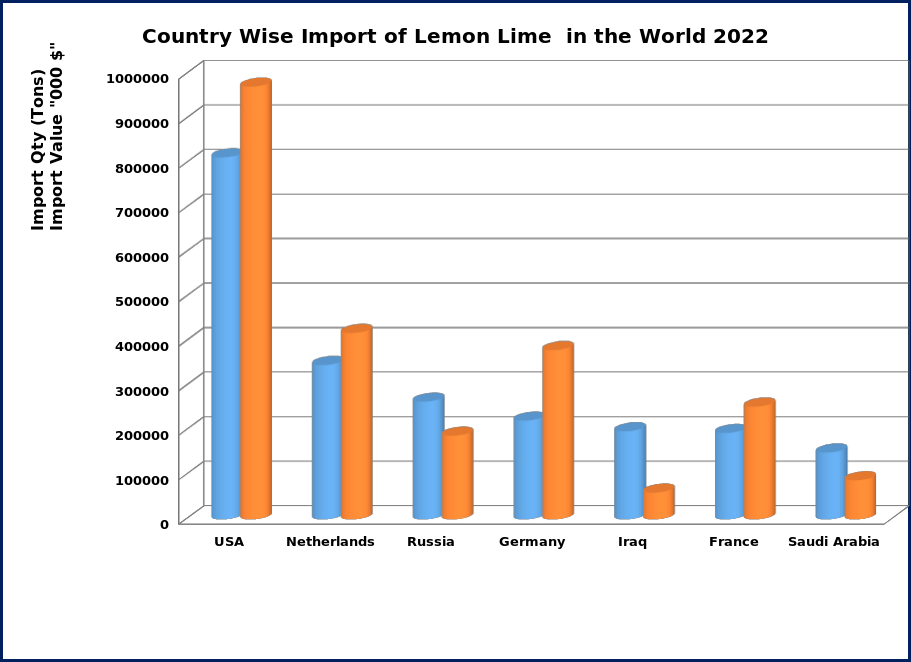
Sheet 49: Lemon Lime
|
Country Wise Export of
Lemon Lime in the World Year 2022 |
|
Country Wise Import of
Lemon Lime in the World Year 2022 |
||||||
|
Sr. No. |
Countries |
Export Qty. in Tons |
Export Value in 000 $ |
|
Sr. No. |
Countries |
Import Qty. in Tons |
Import Value in 000 $ |
|
1 |
Mexico |
715778 |
818979 |
|
1 |
USA |
813425 |
972226 |
|
2 |
Spain |
648194 |
858575 |
|
2 |
Netherlands |
346882 |
418881 |
|
3 |
Türkiye |
590703 |
269879 |
|
3 |
Russia |
264575 |
188033 |
|
4 |
South Africa |
557322 |
355982 |
|
4 |
Germany |
221918 |
380411 |
|
5 |
Netherlands |
269152 |
435789 |
|
5 |
Iraq |
198102 |
60367 |
|
6 |
Argentina |
255476 |
159031 |
|
6 |
France |
194349 |
253481 |
|
7 |
Egypt |
181243 |
65263 |
|
7 |
Saudi Arabia |
150365 |
87938 |
|
8 |
Brazil |
156253 |
152191 |
|
8 |
UK |
146663 |
173867 |
|
9 |
USA |
125233 |
200640 |
|
9 |
UAE |
140795 |
93521 |
|
10 |
UAE |
67216 |
63357 |
|
10 |
Poland |
136572 |
160449 |
|
11 |
Portugal |
63235 |
66802 |
|
11 |
Italy |
111969 |
126254 |
|
12 |
Chile |
56278 |
51455 |
|
12 |
Canada |
110078 |
152527 |
|
13 |
Colombia |
53200 |
82710 |
|
13 |
Spain |
74507 |
84545 |
|
14 |
Viet Nam |
49130 |
45089 |
|
14 |
Romania |
59809 |
63689 |
|
15 |
Italy |
44348 |
73614 |
|
15 |
Portugal |
58807 |
59888 |
|
Total of Top 15 Countries |
3832761 |
3699356 |
|
Total of Top 15 Countries |
3028815 |
3276077 |
||
|
66 |
Pakistan |
476 |
233 |
|
Total of 139 Other Countries |
943840 |
1082275 |
|
|
Total of 95 Other Countries |
309160 |
332134 |
|
World Total |
3972655 |
4358352 |
||
|
World Total |
4141920 |
4031490 |
|
Source: FAO |
|
|
|
|
|
Source: FAO |
|
|
|
|
|
|
|
|
Sheet 50: Export of Lemon Lime
|
|
|
![]()
Sheet 51: Import of Lemon Lime
|
|
|
![]()
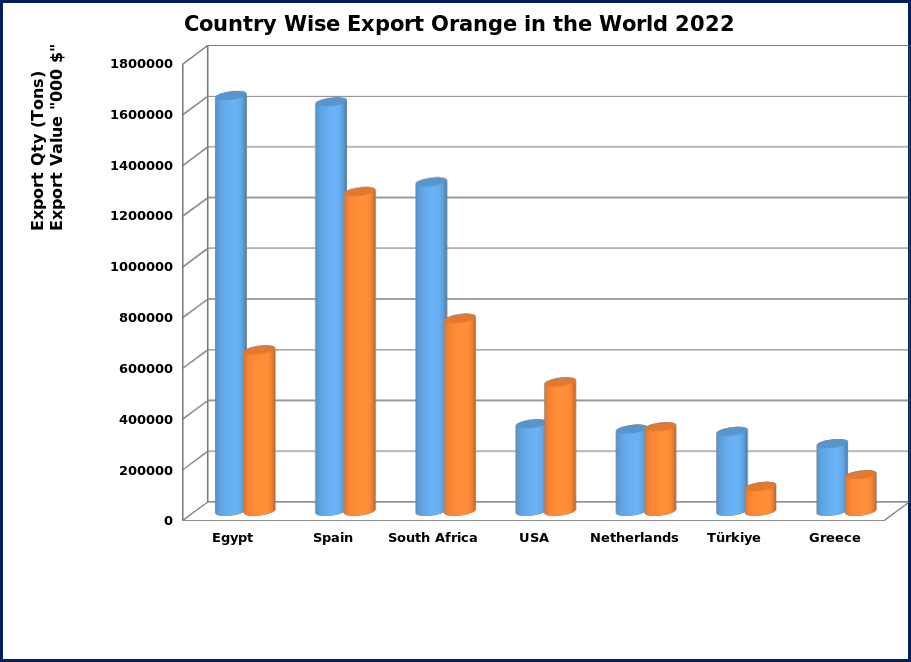
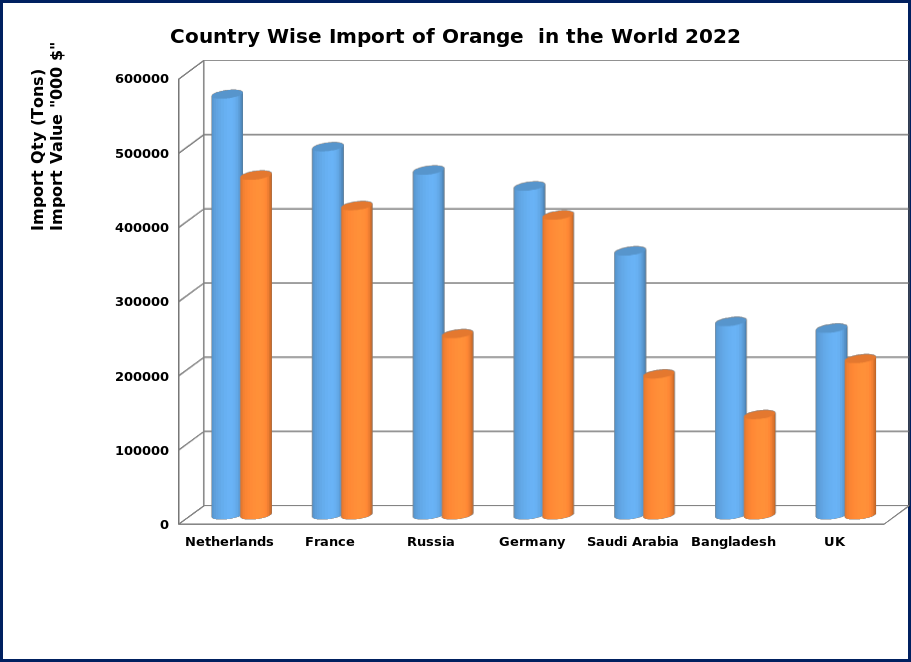
Sheet 52: Orange
|
Country Wise Export of
Orange in the World Year 2022 |
|
Country Wise Import of
Orange in the World Year 2022 |
||||||
|
Sr. No. |
Countries |
Export Qty. in Tons |
Export Value in 000 $ |
|
Sr. No. |
Countries |
Import Qty. in Tons |
Import Value in 000 $ |
|
1 |
Egypt |
1639486 |
635776 |
|
1 |
Netherlands |
567134 |
457916 |
|
2 |
Spain |
1614498 |
1260196 |
|
2 |
France |
496117 |
416772 |
|
3 |
South Africa |
1298435 |
759894 |
|
3 |
Russia |
464641 |
244295 |
|
4 |
USA |
344615 |
509280 |
|
4 |
Germany |
443175 |
404087 |
|
5 |
Netherlands |
323735 |
332435 |
|
5 |
Saudi Arabia |
355754 |
190018 |
|
6 |
Türkiye |
314313 |
97706 |
|
6 |
Bangladesh |
260619 |
135245 |
|
7 |
Greece |
266336 |
143908 |
|
7 |
UK |
251647 |
210666 |
|
8 |
Australia |
143288 |
166205 |
|
8 |
Iraq |
243435 |
61206 |
|
9 |
Portugal |
140192 |
104614 |
|
9 |
UAE |
231410 |
136153 |
|
10 |
Morocco |
123044 |
86243 |
|
10 |
USA |
231017 |
269876 |
|
11 |
Italy |
96844 |
111990 |
|
11 |
China |
209716 |
228244 |
|
12 |
India |
89077 |
37954 |
|
12 |
Italy |
193522 |
135905 |
|
13 |
UAE |
82151 |
63048 |
|
13 |
Hong Kong |
185996 |
244275 |
|
14 |
Chile |
81381 |
83130 |
|
14 |
Canada |
182717 |
225310 |
|
15 |
Mexico |
73187 |
37856 |
|
15 |
Poland |
166963 |
124678 |
|
Total of Top 15 Countries |
6630583 |
4430235 |
|
Total of Top 15 Countries |
4483863 |
3484646 |
||
|
31 |
Pakistan |
10896 |
2173 |
|
Total of 153 Other Countries |
2546074 |
1996377 |
|
|
Total of 95 Other Countries |
784712 |
459842 |
|
World Total |
7029937 |
5481023 |
||
|
World Total |
7415296 |
4890077 |
|
Source: FAO |
|
|
|
|
|
Source: FAO |
|
|
|
|
|
|
|
|
Sheet 53: Export of Orange
|
|
|
![]()
Sheet 54: Import of Orange
|
|
|
![]()
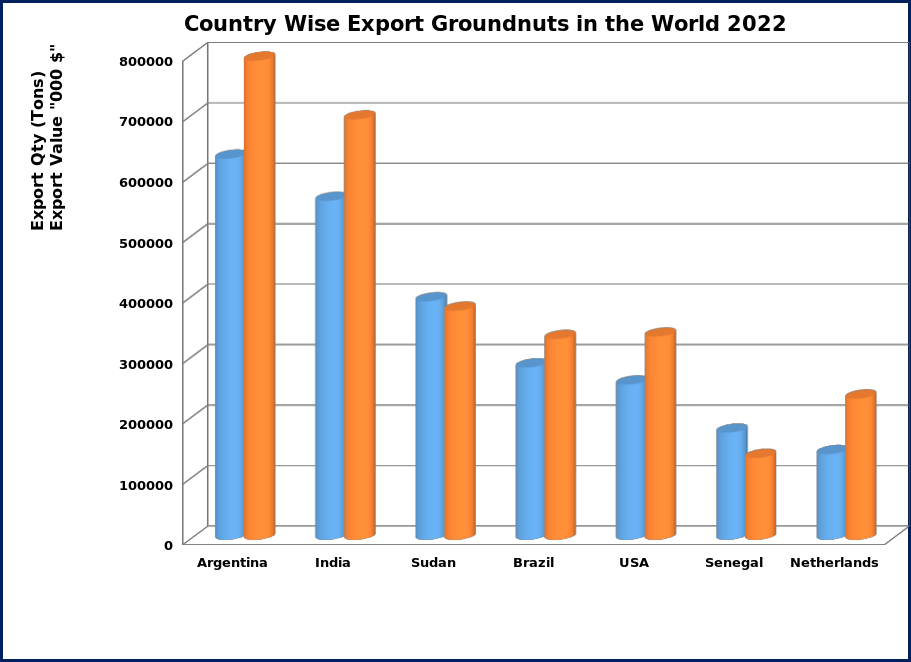
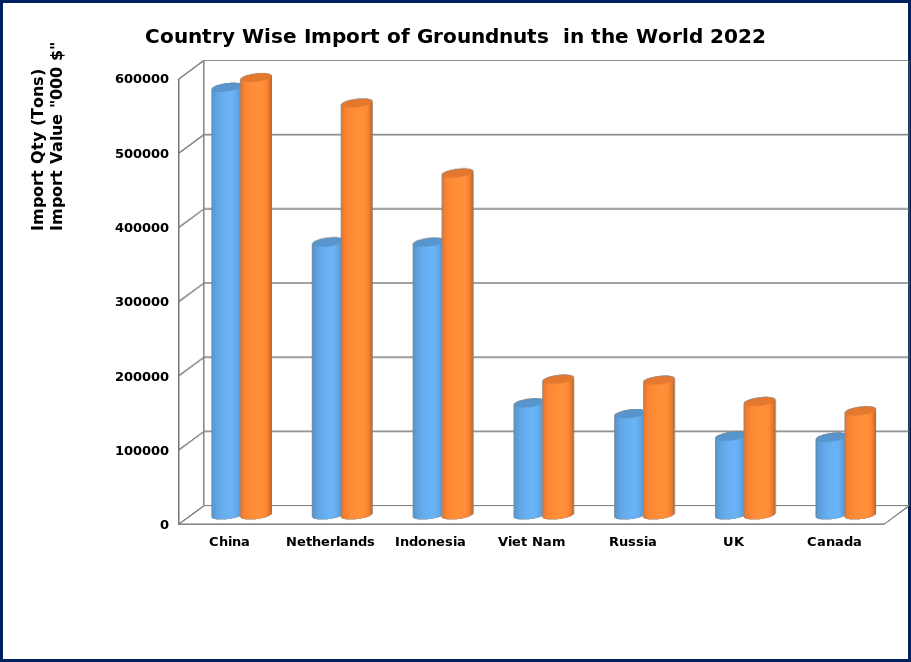
Sheet 55: Groundnuts
|
Country Wise Export of
Groundnuts in the World Year 2022 |
|
Country Wise Import of
Groundnuts in the World Year 2022 |
||||||
|
Sr. No. |
Countries |
Export Qty. in Tons |
Export Value in 000 $ |
|
Sr. No. |
Countries |
Import Qty. in Tons |
Import Value in 000 $ |
|
1 |
Argentina |
630842 |
793139 |
|
1 |
China |
576436 |
589463 |
|
2 |
India |
560912 |
695794 |
|
2 |
Netherlands |
367828 |
555138 |
|
3 |
Sudan |
394767 |
379228 |
|
3 |
Indonesia |
367586 |
460844 |
|
4 |
Brazil |
285315 |
332489 |
|
4 |
Viet Nam |
150996 |
182771 |
|
5 |
USA |
257021 |
336315 |
|
5 |
Russia |
136391 |
181554 |
|
6 |
Senegal |
177417 |
135551 |
|
6 |
UK |
106006 |
152894 |
|
7 |
Netherlands |
141786 |
233708 |
|
7 |
Canada |
104716 |
140190 |
|
8 |
Nicaragua |
87196 |
107594 |
|
8 |
Germany |
103686 |
153879 |
|
9 |
China |
80943 |
142477 |
|
9 |
Philippines |
99500 |
48673 |
|
10 |
Malawi |
75356 |
80492 |
|
10 |
Mexico |
82993 |
107703 |
|
11 |
Mozambique |
63622 |
41623 |
|
11 |
Poland |
77698 |
116446 |
|
12 |
Tanzania |
58676 |
21973 |
|
12 |
Malaysia |
53319 |
73291 |
|
13 |
Madagascar |
30424 |
11635 |
|
13 |
Thailand |
52676 |
50684 |
|
14 |
Egypt |
30010 |
50831 |
|
14 |
Algeria |
49159 |
61431 |
|
15 |
Myanmar |
19631 |
19963 |
|
15 |
Spain |
38964 |
64485 |
|
Total of Top 15 Countries |
2893917 |
3382812 |
|
Total of Top 15 Countries |
2367956 |
2939446 |
||
|
Total of 80 Other Countries |
170226 |
201317 |
|
Total of 138 Other Countries |
689665 |
914723 |
||
|
World Total |
3064143 |
3584129 |
|
World Total |
3057620 |
3854169 |
||
|
Source: FAO |
|
|
|
|
Source: FAO |
|
|
|
Sheet 56: Export of Groundnuts
|
|
|
![]()
Sheet 57: Import of Groundnuts
|
|
|
![]()